Leveraging Google BigQuery's machine learning capabilities for analysis in Tableau
At Tableau, we believe in enabling people of all skill levels to gain insight from their data. Our platform is built on an intuitive interface that empowers anyone to ask and answer questions of their data, regardless of volume or complexity. As advanced and smart analytics are increasingly critical components of business intelligence, business users require tools that simplify their workflows while empowering them to ask deeper questions. When Google Cloud informed us that they were releasing a new way to leverage machine learning technologies, I immediately wanted to know how Tableau could connect.
Machine learning has been a hot topic in analytics for some time. By definition, machine learning is a method of data analysis that uses statistical techniques to give computers the ability to “learn,” without being explicitly programmed. Those who work with machine learning know that it’s a powerful method, but that it can also be shrouded in confusion due to its interpreted complexity. At its core, however, there are many aspects to machine learning that are applicable to anyone that works with data.
Google Cloud just announced a new machine learning feature of BigQuery called BigQuery ML. BigQuery ML allows users to use embedded machine learning technology to train models based on data stored in BigQuery. This essentially means that with a little understanding of SQL and basic machine learning practices you can create and use your own machine learning models. However, just like working with any other data, directly querying a database isn’t always the ideal method to explore the output of your model.
This is where Tableau comes in. With its BigQuery connector, Tableau allows you to easily manipulate the results of your predictive models in a way that facilitates an intuitive understanding of the data. By minimizing the amount of SQL you have to write, and leveraging BigQuery’s astoundingly simple syntax, Tableau is simplifying machine learning for the hundreds of thousands of workers who could benefit from it, but haven’t had the time to learn how. Additionally, Tableau allows users an easy way to share their model and its results with others so that they can benefit from all your work.
Anyone who has built machine learning models knows that whatever you can do to simplify the practice will be a huge step toward bringing machine learning into the masses. This fits naturally with Tableau’s mission to help people see and understand data. Google Cloud and Tableau are working together to enable you to access cutting edge technologies using easy-to-understand techniques.
See it in action: Using Google BigQuery ML and Tableau to predict housing prices
Below, we’ve written a guide on how to use Google BigQuery ML to create a map of predicted housing prices for all the zip codes in the Seattle area. There are online services, like Zillow, that will make this type of prediction for you, but this process is repeatable for any problem you have. This is especially useful if a company doesn’t already exist that solves the problem for you.
Imagine you're a real estate agent and a potential buyer approaches you with various requirements for a home. We’ll assume you've got a dataset in Google BigQuery and you know that a machine learning model could help your reporting. You might want to take existing housing price data and build a model to predict home values in a particular area given a set of features (or predictors). Using Google BigQuery ML, you can now build predictive models and visualize them directly in Tableau for an interactive experience.
Step 1: Log into the BigQuery console and select Compose Query

In this example, there’s already housing data loaded into BigQuery under a project called king_county_housing. The dataset contains a list of houses that were sold, the price at which they were sold, and some useful features of the house like the number of bedrooms, bathrooms, etc. I extracted this dataset from Kaggle and imported it in to BigQuery.
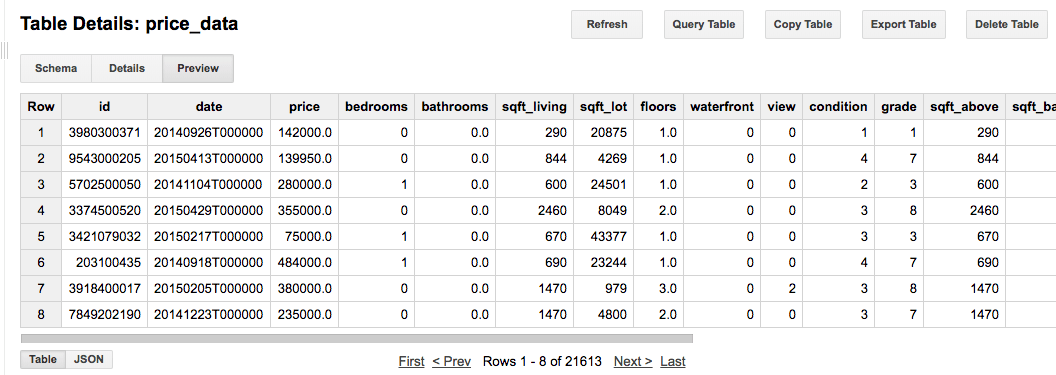
Step 2: Train your model in Google BigQuery using the interface

Determine the fields you want to train your model on, and the variable you're trying to predict.
In this case, I want to predict housing price based on five major features of the house that clients are likely to set as requirements—bedrooms, bathrooms, square feet of living space, whether or not the house is near the water, and the location of the house.
Note that the more features I'd like the model to consider before determining a price, the more features I'll need to tell the model to consider every time I want a prediction. Since I don't want clients to have to fill out a long questionnaire, I want to keep my model relatively simple. This means that while my predictions may not be as accurate, I'll have an easier interface to interact with.
Create a new model using the special syntax:

Note here that I'm casting zipcode as a text field rather than leaving it as an integer. This is because the model will automatically treat any integer as a numerical value rather than a categorical value. If you leave zipcode as a numerical value, the model will treat zipcode as if it were something like square feet, where the larger the zipcode the more expensive the house. Since we know zip codes are not directly correlated with housing price, we need to cast the value to a string, where each zip code will be treated like a label and will get it's own coefficient associated with it.
The special syntax is composed of 4 parts:
- CREATE MODEL — This is the basic model building keyword. The result of running this query will be a special table in BigQuery that contains no data, but returns a new value when you submit all relevant columns into that table using special syntax.
 — The result of running this query.
 — Define the model you'd like google to use when creating the query. There are many more options you can add, but these are the minimum necessary. See Google's documentation for more details. There are two supported models right now: Linear Regression with Regularization and Binary Logistic Regression with Regularization. The column_name that you input will be the formal column name of the table from which you're querying training data.
- AS SELECT — a standard SQL query that returns a list of columns and rows to be used for training.
Note that I added in (OR REPLACE) because it took me a couple tries to get this model right, and it's easier to simply update the model from an existing one using the same query.
Step 3: Open Tableau Desktop & connect to your BigQuery data source
Select Google BigQuery from the left hand navigation under to a Server and enter your credentials.
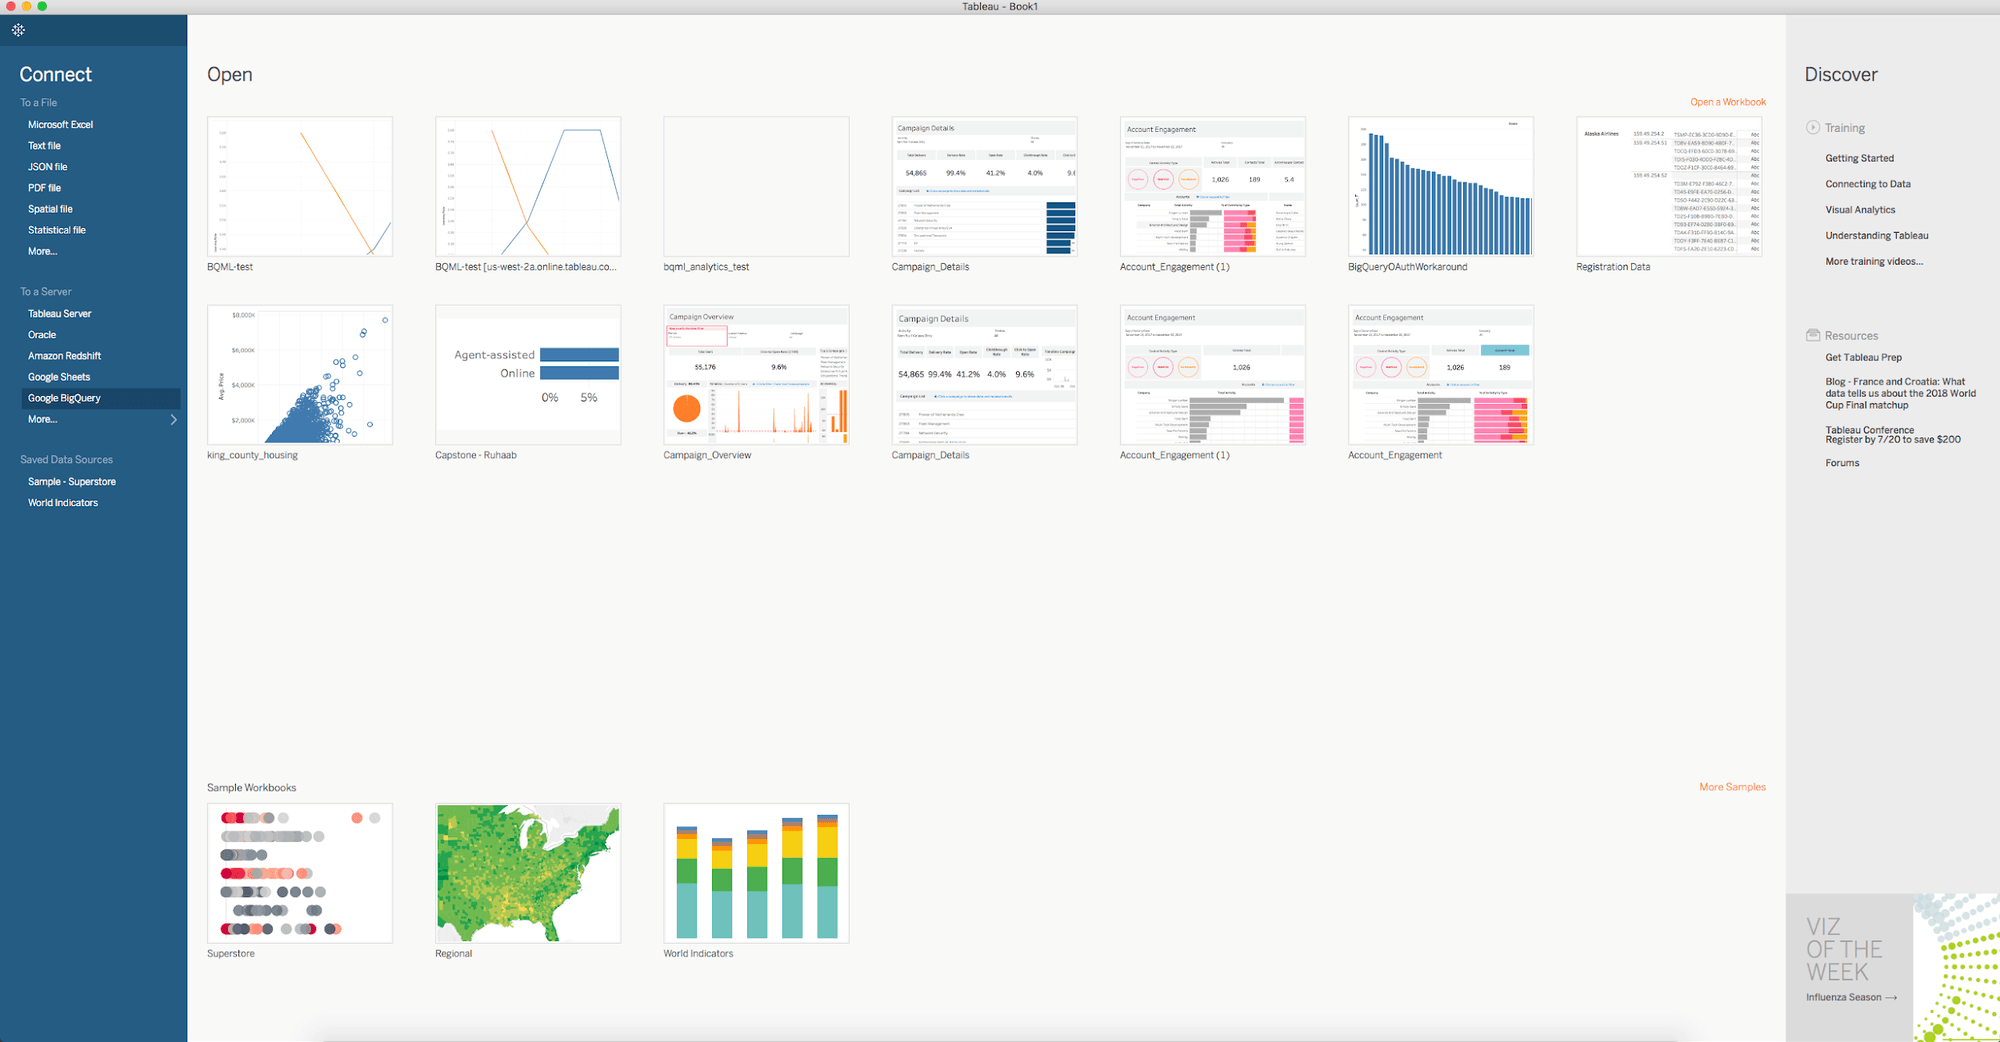
Select the relevant following information.

Step 4: Create a custom SQL Query using the special Google syntax
Open the New Custom SQL box.
Query the newly created table using the key phrase 
Here you just enter a query that creates a table that has all the values that are in the prediction table. If you don't know the value, enter NULL.
Because we're going to be asking the user for input data, create the following parameters and set reasonable default values for them:
- You'll likely want to reference the data types that were used during model creation. To do this, simply refer to the BigQuery UI and select Schema.
- Bedrooms, integer (default: 2), Allowable values: Range (min: 0, max: 10, step size: 1)
- Bathrooms, float (default: 2), Allowable values: Range (min: 0, max: 10, step size: 1)
- Square_feet_living, integer (default: 2000)
- Waterfront_view, integer (default: 0), Allowable values: Range (min: 0, max: 1, step size: 1)
The query that I'm going to use selects all of the zip code values from the table that we used for training and simulates test data rows by capturing user inputs via parameters. This will be useful later when we want to create a map of all the price predictions for every zip code.

If you want to check yourself, try running your query in the BigQuery UI with dummy data in place of the parameters.
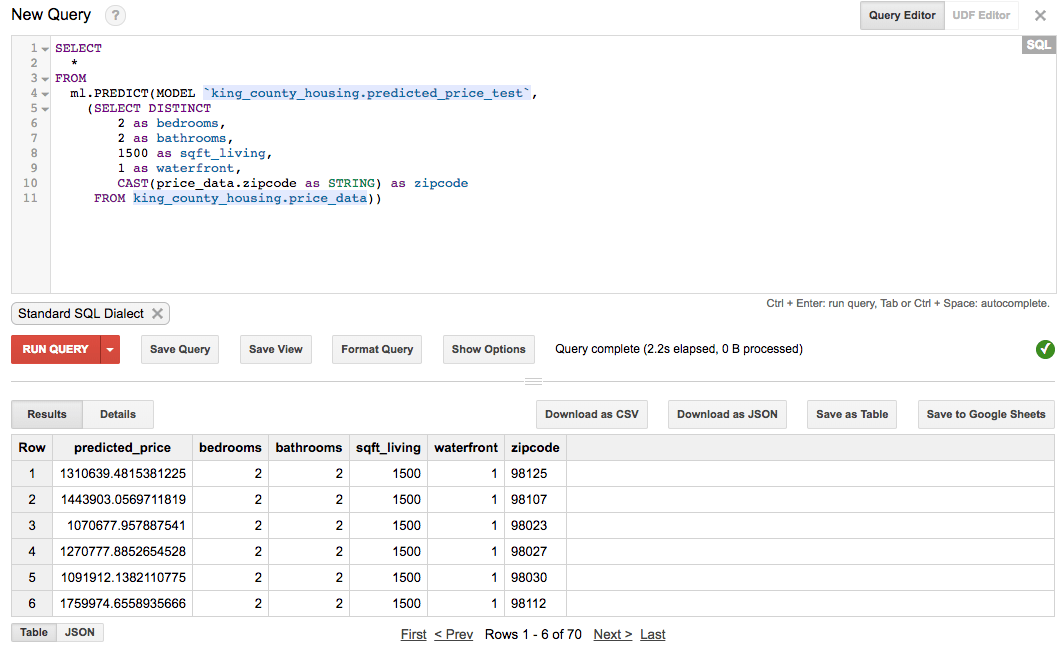
Step 5: Create a viz using the results and the parameters
Create a map:
- Go to your worksheet and double click zipcode.
- On the top navigation select Map > Map Layers and show Zip Code Labels & Place Names.
- Close the Map Layers sidebar.

Display the price by zip code:
- Drag predicted_price onto label.
- Format by right clicking on SUM(predicted_price) in the Marks panel.
- Under Default > Numbers > Currency (Custom):
- 1 decimal place
- Display Units > Millions
- Close the Format panel.
- Click Label > […] (next to Text).
- Click
and change the color to white.
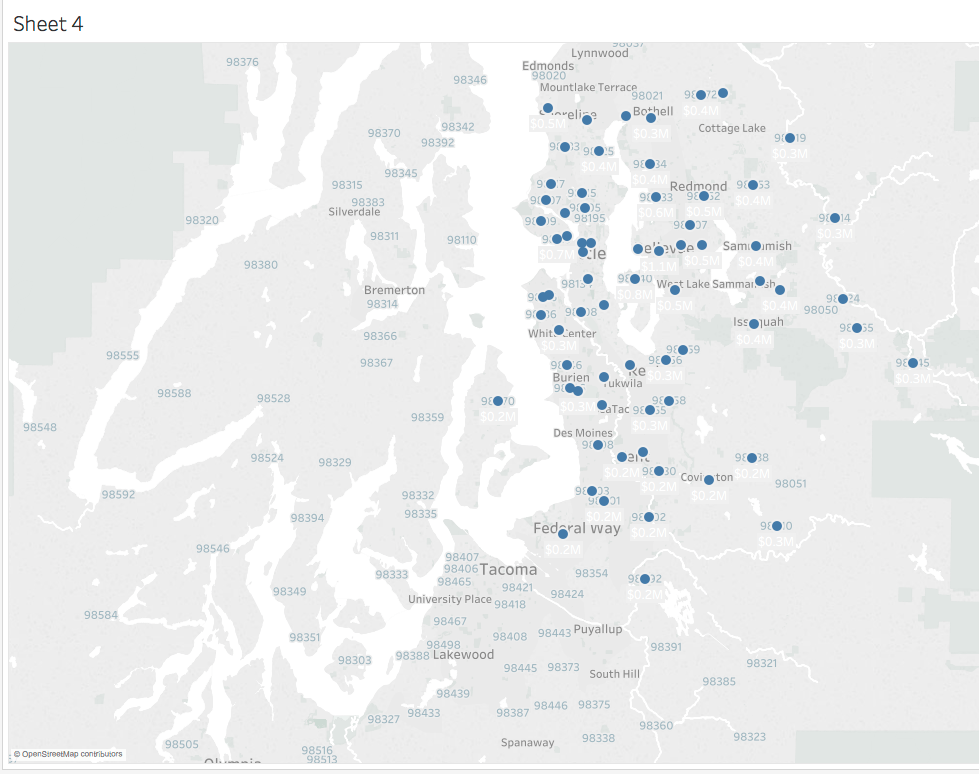
Make the colors easy to interpret:
- Hold Ctrl and drag SUM(predicted_price) onto Color.
- Click on Color > Edit Colors…
- Palette: Red-Green-Gold Diverging
- Stepped Color: 10 Steps
- Reversed
- Advanced > Center = 750,000
- OK
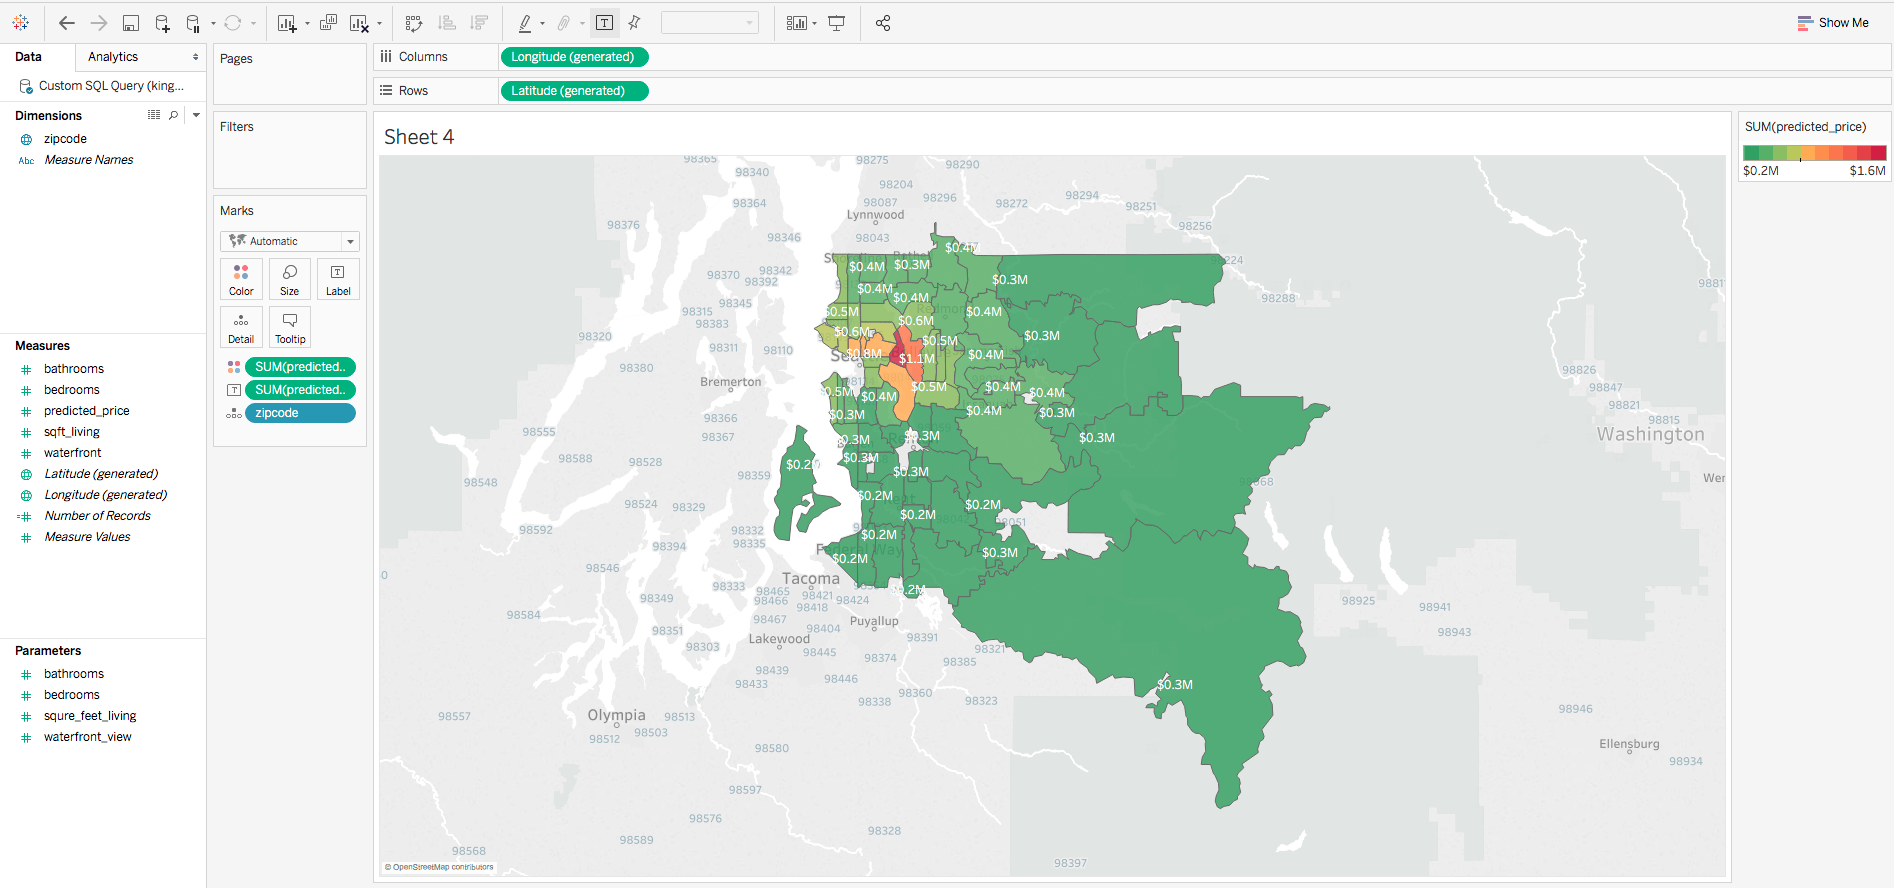
Make the text size change based on value:
- Hold Ctrl and drag SUM(predicted_price) onto Size.
- Change the Marks type from Automatic to Map.
- Click the Size Mark.
- Drag the slider over an inch and select apply (you can edit this to your liking later).
- Ctrl + click each of your parameters and right click to select Show Parameter Control.
- Try playing with your parameters to see how the model predicts housing prices.

While custom SQL is necessary in this exercise for invoking a machine learning algorithm in Google BigQuery ML, there are performance considerations to be aware of when using custom SQL in lieu of Tableau’s native connections in other scenarios. When possible, leverage Tableau's native data source connections for optimized performance. Read more here.
Acknowledgments: Special thanks to Abhishek Kashyap (Google), Vaidy Krishnan (Tableau) and Riley Maris (Tableau) for their guidance.
Related Stories
Subscribe to our blog
Get the latest Tableau updates in your inbox.


