How Explain Data’s MIT origins helped bring AI to the analyst
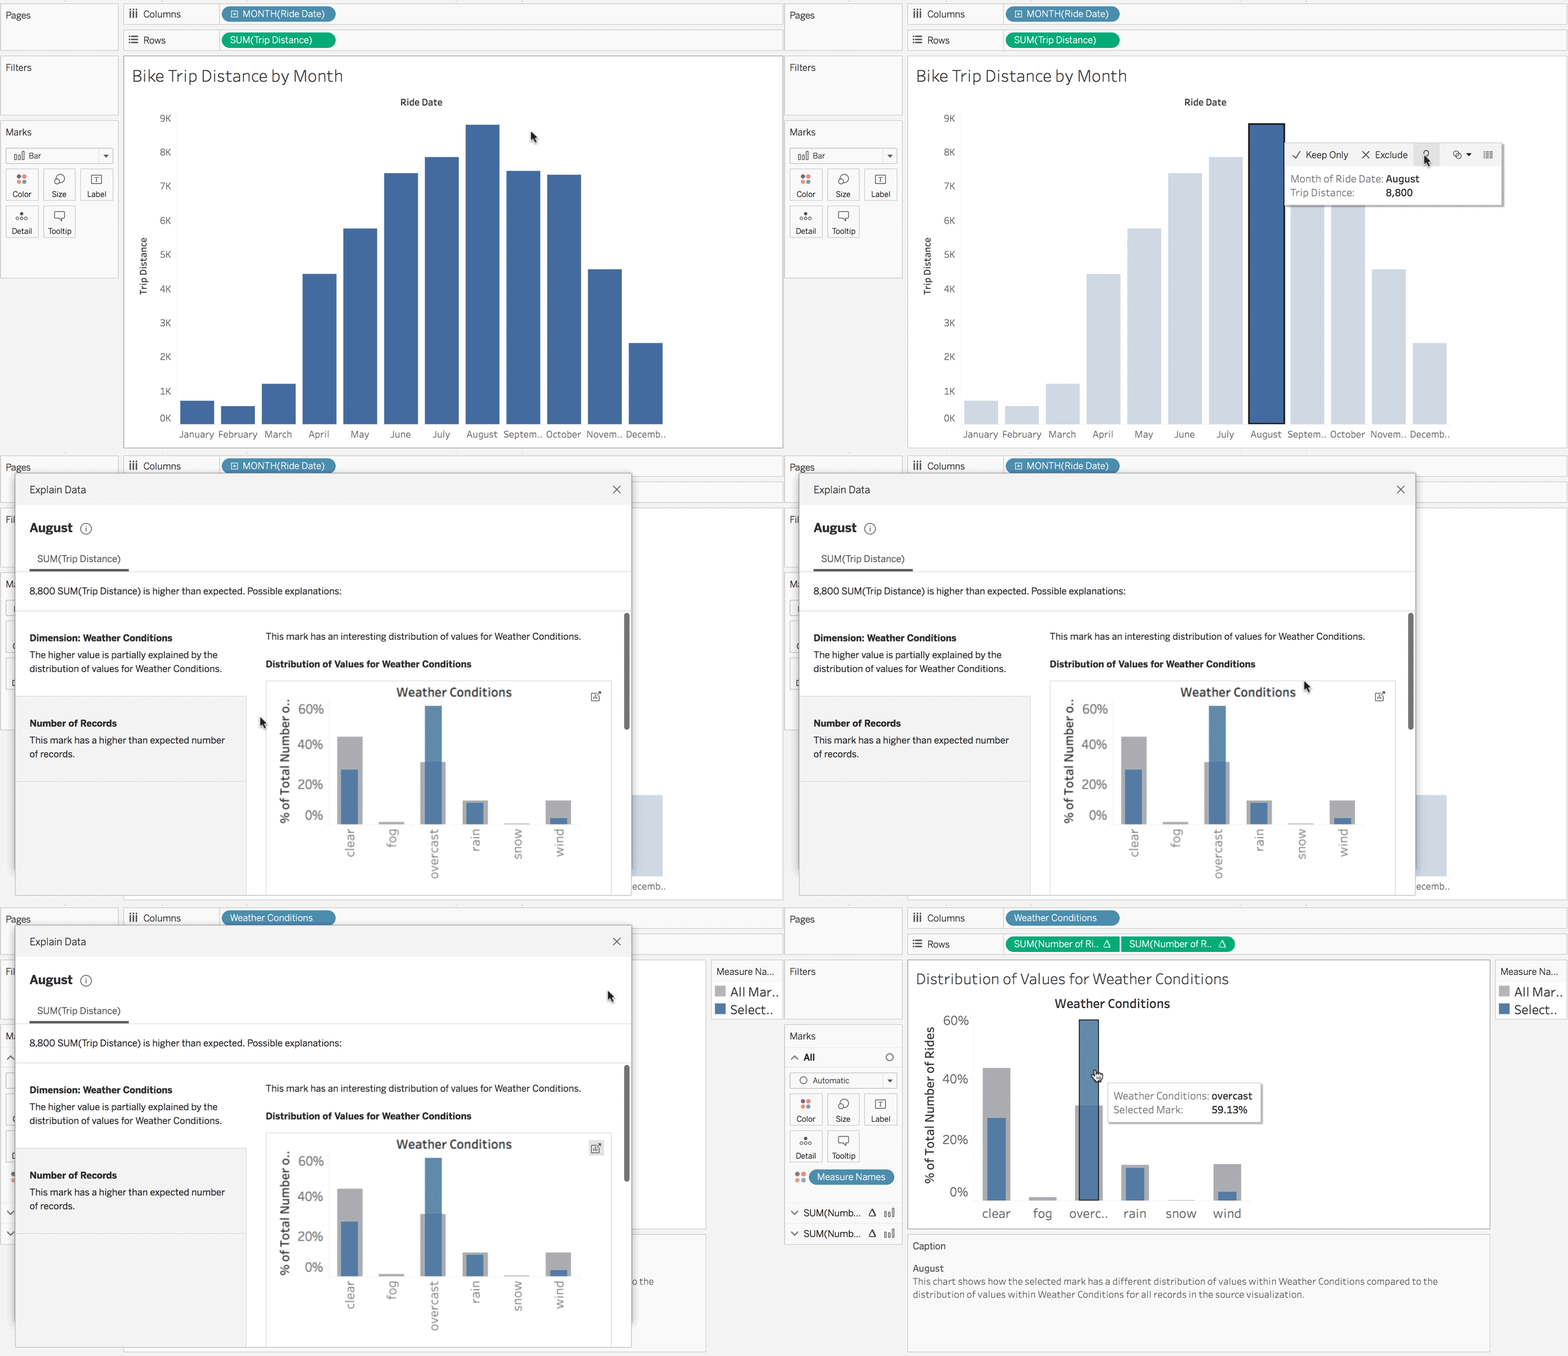
Explain Data, now in Tableau 2019.3, helps accelerate your analytics by leveraging the power of artificial intelligence (AI) to explain specific points in your data. Before the technology made its way into Tableau, it started as an academic project at the MIT Probabilistic Computing Project, funded through a grant around explainable AI.
We spoke to Richard Tibbetts (Principal Product Manager for AI and former CEO of Empirical Systems) about Explain Data’s origins, including its first encounter with the Superstore data set, and some exciting possibilities for the future.
1. Explain Data’s origins are rooted in the Probabilistic Computing Project at MIT. How did this technology develop?
Richard Tibbetts (RT): A research scientist at the Massachusetts Institute of Technology (MIT), Vikash K. Mansinghka, created a research system called BayesDB as part of the Probabilistic Computing Project at MIT. BayesDB had two big ideas. The first was to automate the kind of analysis that a trained statistician would do—to be able to take a data set and really explore it and develop a holistic model of that data set. And the second thing was to expose that model with a query-like interface.
BayesDB inspired the technology that would become the Empirical engine, which now powers Explain Data in Tableau. When we originally brought Empirical into the commercial world, we built a new engine and refined it, introduced some new algorithms, as well as new kinds of queries that it could execute.
2. What are the benefits of developing a technology in an academic environment?
RT: The technology was initially funded through a DARPA grant around explainable AI and Probabilistic Programming and Machine Learning (PPML). There are definitely benefits to developing a technology in the academic environment. The first being that we figured out what was possible with the technology. The second being that Vikash and his team had figured out what was really important to people and what got them excited about the technology before bringing it into a commercial setting. It also meant we could do a lot of testing to get to a sustainable solution with our development partners.
3. What was the original intention of the technology behind Explain Data?
RT: One of the big promises with the Empirical engine, which would eventually power Explain Data, was to democratize the tasks that are currently in the purview of statisticians and data scientists. We wanted to figure out how to make AI more trustworthy and how to make machine learning more accessible and more useful for domain experts.

4. Can you talk about the first time you encountered Tableau?
RT: I had the good fortune to sit down with Francois Ajenstat and some others at the Gartner Analytics Summit. Francois shared the Superstore data set—one of the sample data sets in Tableau—in a Google Sheet. I ended up demonstrating Empirical and very quickly got saw that tables were discounted too much, which if you know that data set, you know is one of the punchlines. That was the start of our ongoing conversations. We joined Tableau in June 2018.
There was a wonderful synergy between Empirical's passion for helping people make better decisions and Tableau's focus on helping people see and understand their data.
5. What excites you about the power of Explain Data and Tableau?
RT: When you run Explain Data, you're fitting hundreds of models in order to surface the right explanations. It's not just about saying, do you want to do inferential statistical queries, because people may not realize that those are the kind of problems they have. Their questions are, why are sales down? Explainable AI is often really about human understanding. It's about helping people make decisions, supported by their own domain expertise. And so integrating this technology into Tableau gave us space to innovate in that way.
Working with Tableau's world class user experience, user research teams, and product teams meant we can build out capabilities that can do great things for people. Explain Data is just one way to leverage this technology. There's a bunch of potential applications—from data prep to forecasting to prediction—and we’re thrilled to work with this team to explore all the possibilities.
Try Explain Data for yourself in this interactive demo or download the newest version of Tableau.
Related Stories
Subscribe to our blog
Get the latest Tableau updates in your inbox.


