Hello, world. It’s Tableau 10
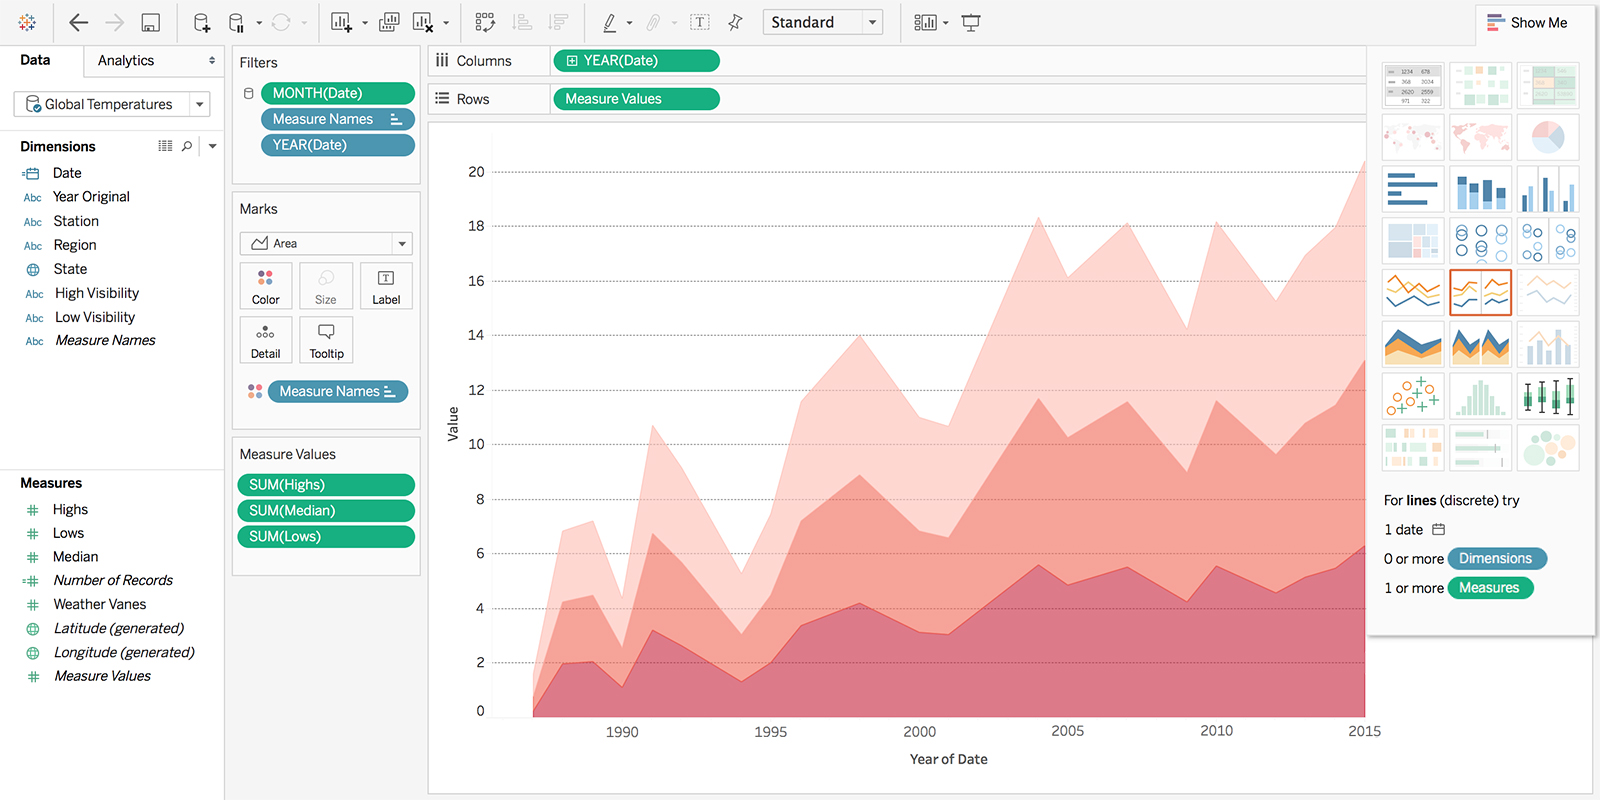
Your data just got hotter, thanks to Tableau 10. So what’s in it? For starters, it has an entirely new look and feel with beautiful fonts and colors to make your viz shine.
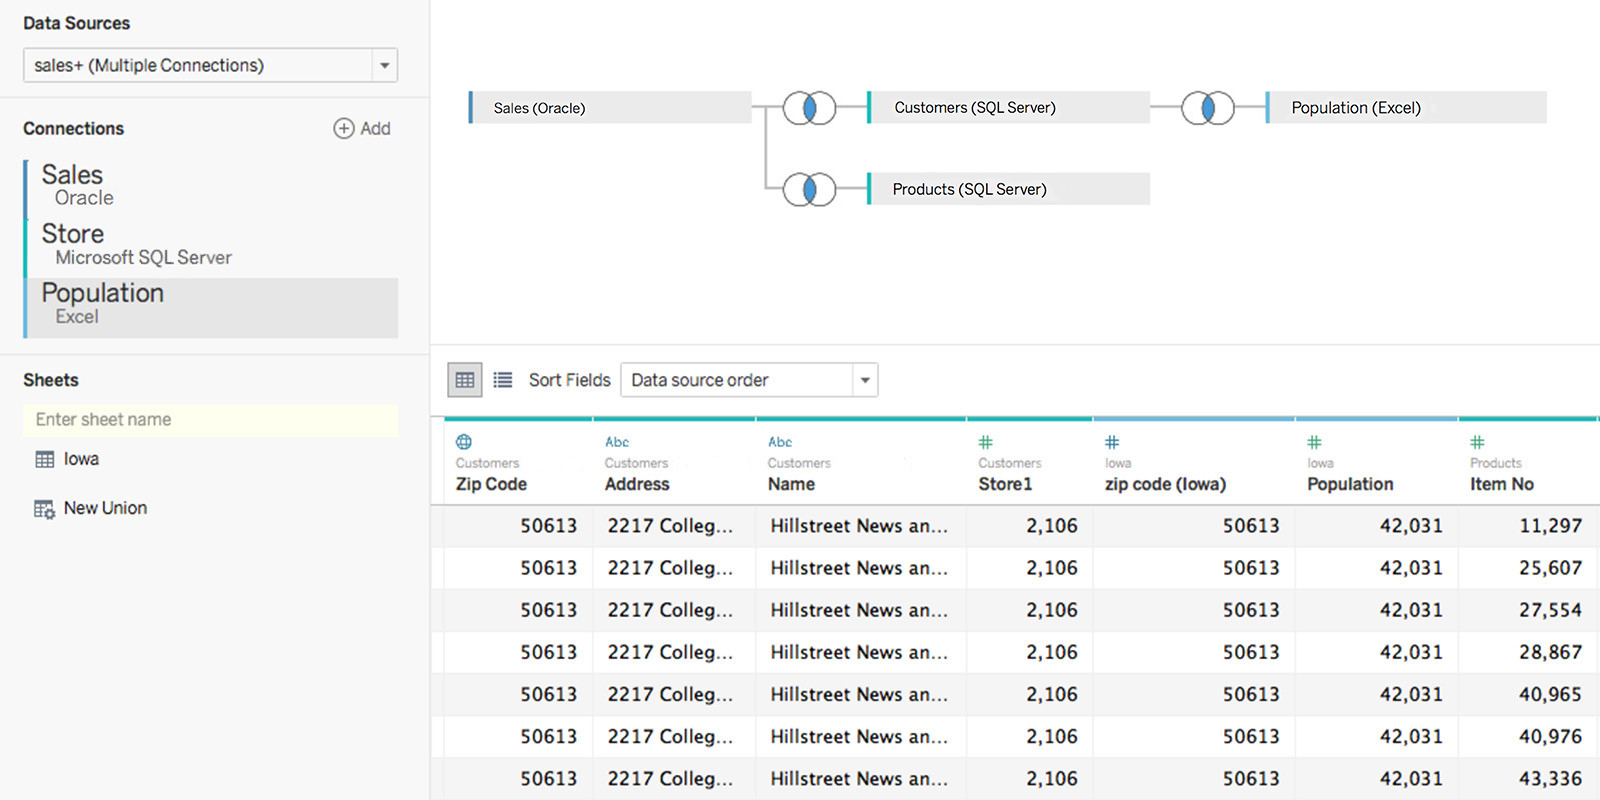
And this beauty’s got some depth, with cross-database joins that let you work across different data sources as if they were one. Now you can make and share an entirely new data source from multiple, disparate date sources like SQL Server and Redshift. Imagine the insights you can find when you can see all your data.
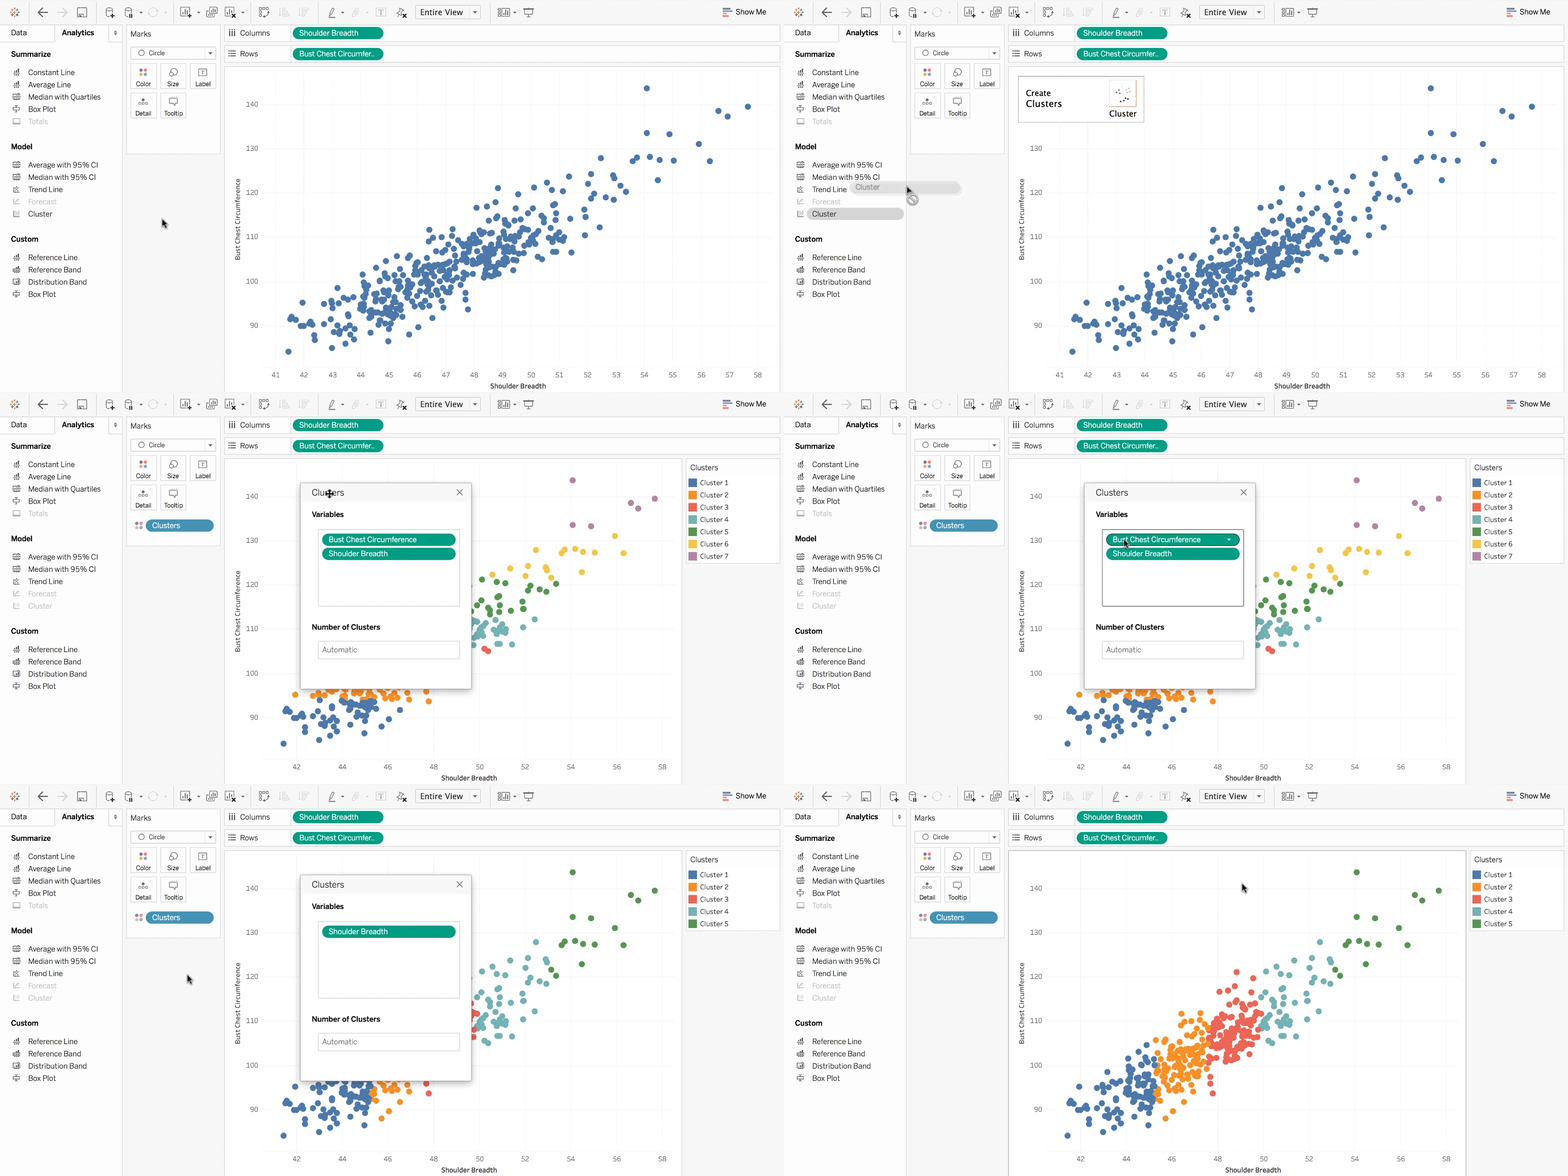
You can also ask deeper questions of your data, thanks to drag-and-drop clustering, custom territories, and the new highlighter.
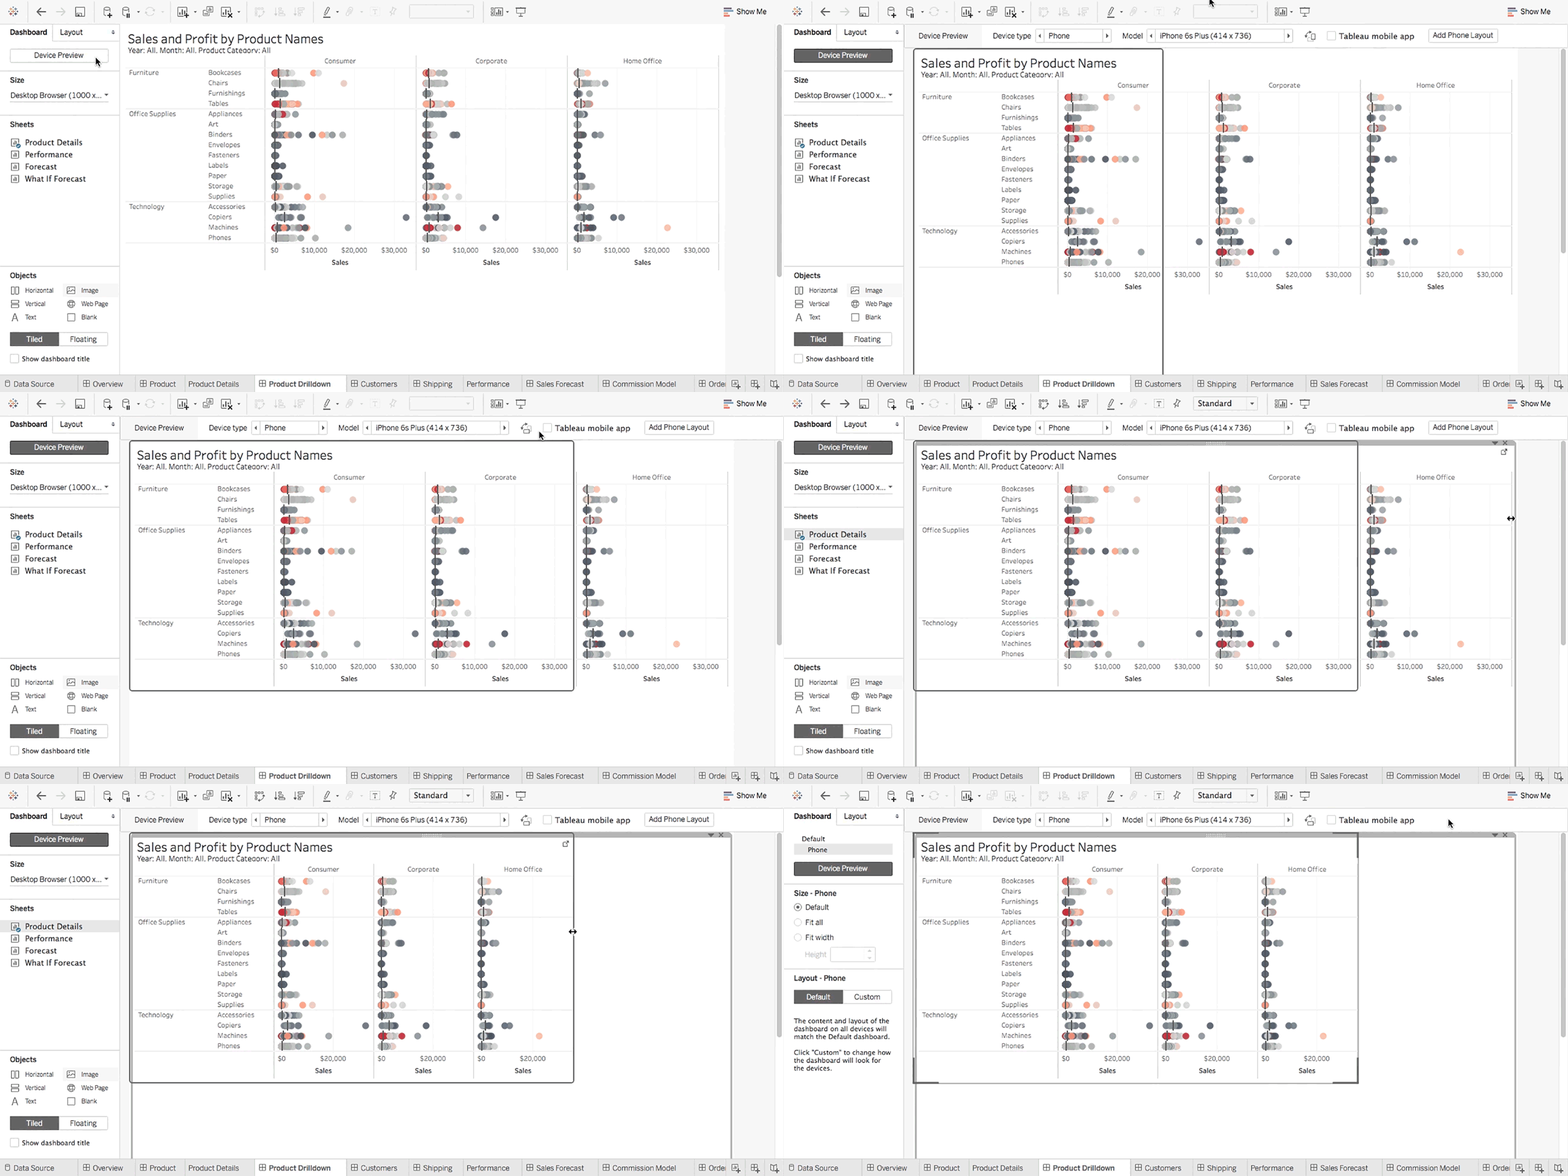
And you can have more control over dashboards consumed on mobile devices, thanks to the new device designer. You can design a single dashboard with optimized views and custom content for any device, including Android, with our new app.
We’re always listening to users, and Tableau 10 is no exception with two of the most-requested features on our Community Ideas Forum. With cross data-source filters, you can quickly filter across data sources without having to use parameters. Subscribe others helps build a culture of analytics by allowing users to subscribe other team members to important dashboards.
These are just a few of the dozens of features included in Tableau 10. Check out the full list.
To learn more, sign up and tune into out launch event, Tableau 10 Live. We'll be showing off top features, hearing from customers, and more. And join us at a Tableau 10 roadshow near you.
Want even more? We’ve completely revamped our free online training with new videos on cross-database joins, device designer, and custom territories. Also check out our Tableau 10 webinars and the rest of the Tableau 10 blogs. Our dev team dives deep into some of the biggest features in Tableau 10.
Learn More about Tableau 10
- Uncover Patterns in Your Data with Tableau 10’s Clustering Feature
- Quickly Find Marks in Context with Tableau 10's New Highlighter
- Build Your Own Custom Territories in Tableau 10
- Do More with Bar Charts in Tableau 10
- Tableau 10 Includes More Maps Data, Multilingual Auto Detection
Answers through Analytics
- Integrate Your Data with Cross-Database Joins in Tableau 10
- As Requested, You Can Filter across Data Sources in Tableau 10
- Do More with APIs in Tableau 10
- Tableau 10 Includes Even More Data-Source Options
- Connect Directly to Google Sheets in Tableau 10
- (Finally!) See and Understand Your IoT Data with Our Google Sheets Connector
- Connect Directly to Your QuickBooks Online Data in Tableau 10
- Favorite Your Data Sources in Tableau 10 Tableau 10 Includes Even More Data-Source Options
Data Breakthroughs
- Check Out the Beautiful Look and Feel of Tableau 10
- Format Your Workbook with Just a Few Clicks in Tableau 10
- How We Designed the New Color Palettes
- Tableau 10 Includes a New Typeface Designed for Data
Beautiful by Design
- Design Dashboards That Shine on Any Device in Tableau 10
- Tips for Designing Device-Specific Dashboards That Make Everyone Happy
- Manage Your Tableau Mobile Deployment with AirWatch or MobileIron
Delightfully Mobile
- Author Dashboards from Scratch on the Web in Tableau 10
- Do More While Publishing Workbooks in Tableau 10
- See a History of Your Revisions in Tableau 10
- What's New in Tableau Online
Do More on the Web
- Check Out the New Enterprise Features in Tableau 10
- Extract-Refresh Fail? Get an Email Alert in Tableau 10
- Subscribe Others to Your Views and Workbooks in Tableau 10
Self-Service at Scale
The momentum for Tableau 10 has been building since we first announced the Tableau 10 beta back in April.
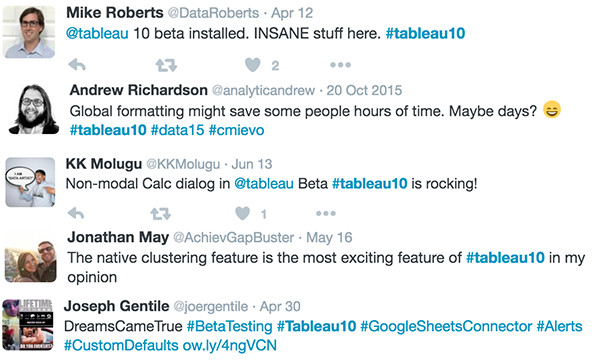
We’d like to extend a huge thank you to the 14,000 beta testers who tried the Tableau 10 beta. If you’d like to be involved in future beta programs, sign up today.
Download Tableau 10 now.
Related Stories
Subscribe to our blog
Get the latest Tableau updates in your inbox.


