DataFam Roundup: May 24 - May 28, 2021


Dig into the latest DataFam Roundup—a weekly blog that brings together community content all in one post. As always, we invite you to send us your content—and the DataFam content from your peers that have inspired you! Find the content submission form here.
In memory of Lakshmi Narayana Syamala
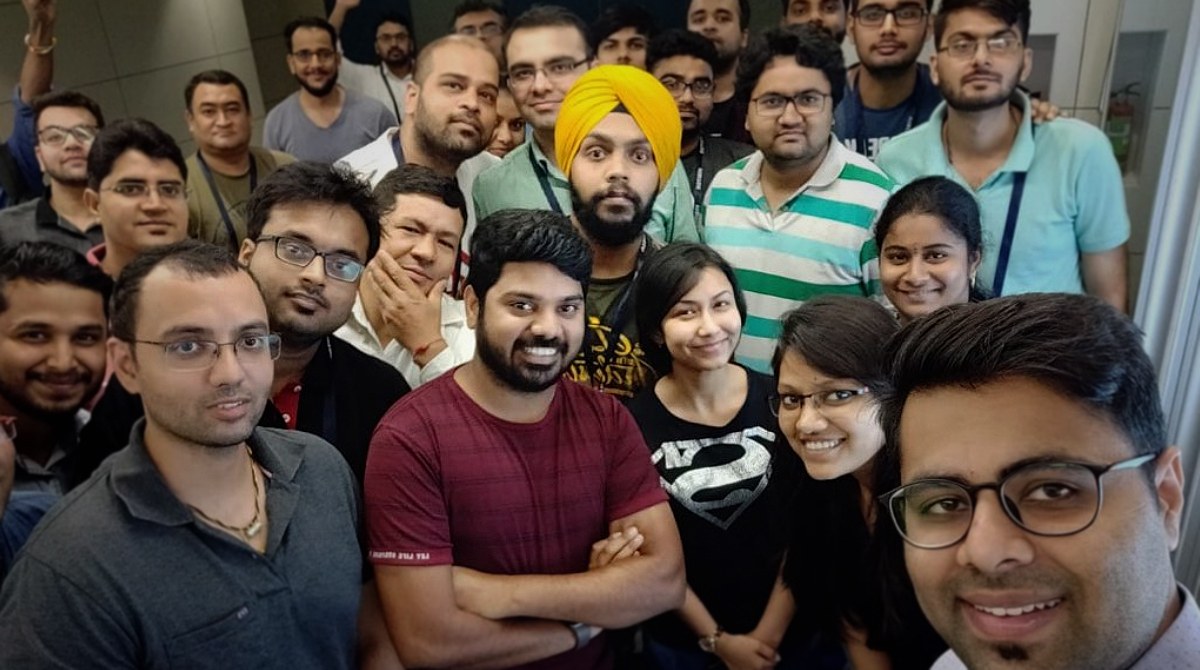
Lakshmi at the Delhi Tableau User Group in 2018. Lakshmi is pictured in the middle wearing a red t-shirt.
In this post, we honor the life of Tableau Ambassador Lakshmi Narayana Syamala and offer opportunities to contribute to his memory.
DataFam content

Iron Quest Games – Recap Sarah Bartlett
Dive into content created by the Tableau Community:
- Tableau your Time Series Forecast with TabPy! Jerry Paul
- Psst! Have you had a go with variables in Tableau yet? Steve Martin (Tableau Community Forums blog—site login required to view)
- How to make your dashboard user-friendly? Priyanka Dobhal
- How to set up an Etsy store? Judit Bekker
- Do you wish you could work a little better with Tableau containers? Ray Givler
- Datageletterdheid en datademocratisering moeten beter Jim De Clercq (Dutch)
- How to Create a Marginal Histogram Andy Kriebel
- Iron Quest Games – Recap Sarah Bartlett
Upcoming events
June 2, 2021: Global Data + Women
Join an upcoming Tableau User Group event:
- June 2, 2021: Global Data + Women
- June 10, 2021: Veterans Advocacy User Group
Check out all the virtual Tableau User Group events here.
Vizzes

Catch this week’s Viz of the Days here and subscribe to get them emailed directly to your inbox.
Check out some inspirational vizzes created by the community:
- BAN designs Kevin Flerlage
-
Typhoon Seasonality Toshiya Kijima
-
San Francisco | Building Ages Naresh Suglani
-
#IronQuest Project Tracker Sarah Bartlett
- Manchester United 2020/21, A visual exploration of Man United's Premier League 2020/21 Season Simon Beaumont and CJ Mayes
- The Rap Queens Simone Bee
- Median Annual Salary for Registered Nurses by State (2001 to 2020) Nick Adams
Community Project Updates

Makeover Monday
Join the community every Monday to work with a given data set and create better, more effective visualizations.
Web: Makeover Monday
Twitter: #MakeoverMonday
Week 21: How are wildlife populations changing?
Workout Wednesday
Build your skills with a weekly challenge to re-create an interactive data visualization.
Web: Workout Wednesday
Twitter: #WOW2021
Week 21: How often is Sean listening to his favorite songs?
Sports Viz Sunday
Create and share data visualizations using rich, sports-themed data sets in a monthly challenge.
Web: Sports Viz Sunday
Twitter: #SportsVizSunday
May 2021: Kentucky Derby
Iron Quest
Practice data sourcing, preparation, and visualization skills in a themed monthly challenge.
Web: Iron Quest
Twitter: #IronQuest
Storytelling with Data
Practice data visualization and storytelling skills by participating in monthly challenges and exercises.
Web: Storytelling with Data
Twitter: #SWDChallenge
May 2021: how we've grown
Project Health Viz
Uncover new stories by visualizing healthcare data sets provided each month.
Web: Project Health Viz
Twitter: #ProjectHealthViz
May 2021: Registered Nursing Labor Stats (1998-2020)
SDG Viz Project
Visualize data about Sustainable Development Goals provided by the World Health Organization.
Web: SDG Viz Project
Twitter: #TheSDGVizProject
Goal 16: Peace, Justice, and Strong Institutions
Preppin' Data
A weekly challenge to help you learn to prepare data and use Tableau Prep.
Web: Preppin’ Data
Twitter: #PreppinData
2021 Week 21: Getting Trolleyed
Real World Fake Data
Create business dashboards using provided data sets for various industries and departments.
Web: Real World Fake Data
Twitter: #RWFD
Dataset #11: Hospitality
Viz 2 Educate
Each month, create vizzes on global education syllabus topics as resources for teachers worldwide.
Web: Viz 2 Educate
Twitter: #Viz2educate
April: Arts & Music
Viz for Social Good
Volunteer to design data visualizations that help nonprofits harness the power of data for social change.
Web: Viz for Social Good
Twitter: #VizforSocialGood
April 22 - May 20, 2021: Crowd2Map
Diversity in Data
An initiative centered around diversity, equity & awareness by visualizing provided datasets each month.
Web: Diversity in Data
Twitter: #DiversityinData
Related Stories

DataFam Roundup: February 24-28, 2025

DataFam Roundup: February 17-21, 2025

DataFam Roundup: February 10-14, 2025
Subscribe to our blog
Get the latest Tableau updates in your inbox.