DataFam Roundup: May 17 - May 21, 2021


Dig into the latest DataFam Roundup—a weekly blog post that brings together what’s trending in the community all in one post. As always, we invite you to send us your content—and the DataFam content from your peers that have inspired you! Find the content submission form here.
DataFam content
Creating Animated Line Charts in Tableau, Marc Reid
Dive into content created by the Tableau Community:
- Use Tableau Public in the browser for FREE! New in tableau 2021.1 Tim Ngwena (video)
- Tableau: Design your Tableau Portfolio Priyanka Dobhal (blog)
- How to… use String functions Carl Allchin (blog)
- Creating Animated Line Charts in Tableau Marc Reid (blog)
- Don’t spill your wine by not knowing about your Order of Operations Annabelle Rincon (blog)
- Looking for something? Try Tableau Public Search (Tableau Public blog)
Upcoming events

May 26, 2021: Ahmedabad Fireside Chat with Francois
Join an upcoming Tableau User Group event:
- May 26, 2021: Data+Women Speak Up!
- May 26, 2021: Ahmedabad Fireside Chat with Francois
- May 27, 2021: Mothers' Day Special #recognise
- June 2, 2021: Global Data + Women
- June 10, 2021: Veterans Advocacy User Group
Check out all the virtual Tableau User Group events here.
Zero to Zen Watch the recordings of Tableau Zen Master Jim Dehner's 5-part series where he shares the five foundational concepts he learned on his journey from spreadsheets to Tableau.
Vizzes
Catch this week’s Viz of the Days here and subscribe to get them emailed directly to your inbox.
Check out some inspirational vizzes created by the community:
- mygarden2021 masato watanabe
- Make a wish for an healthier life Annabelle Rincon
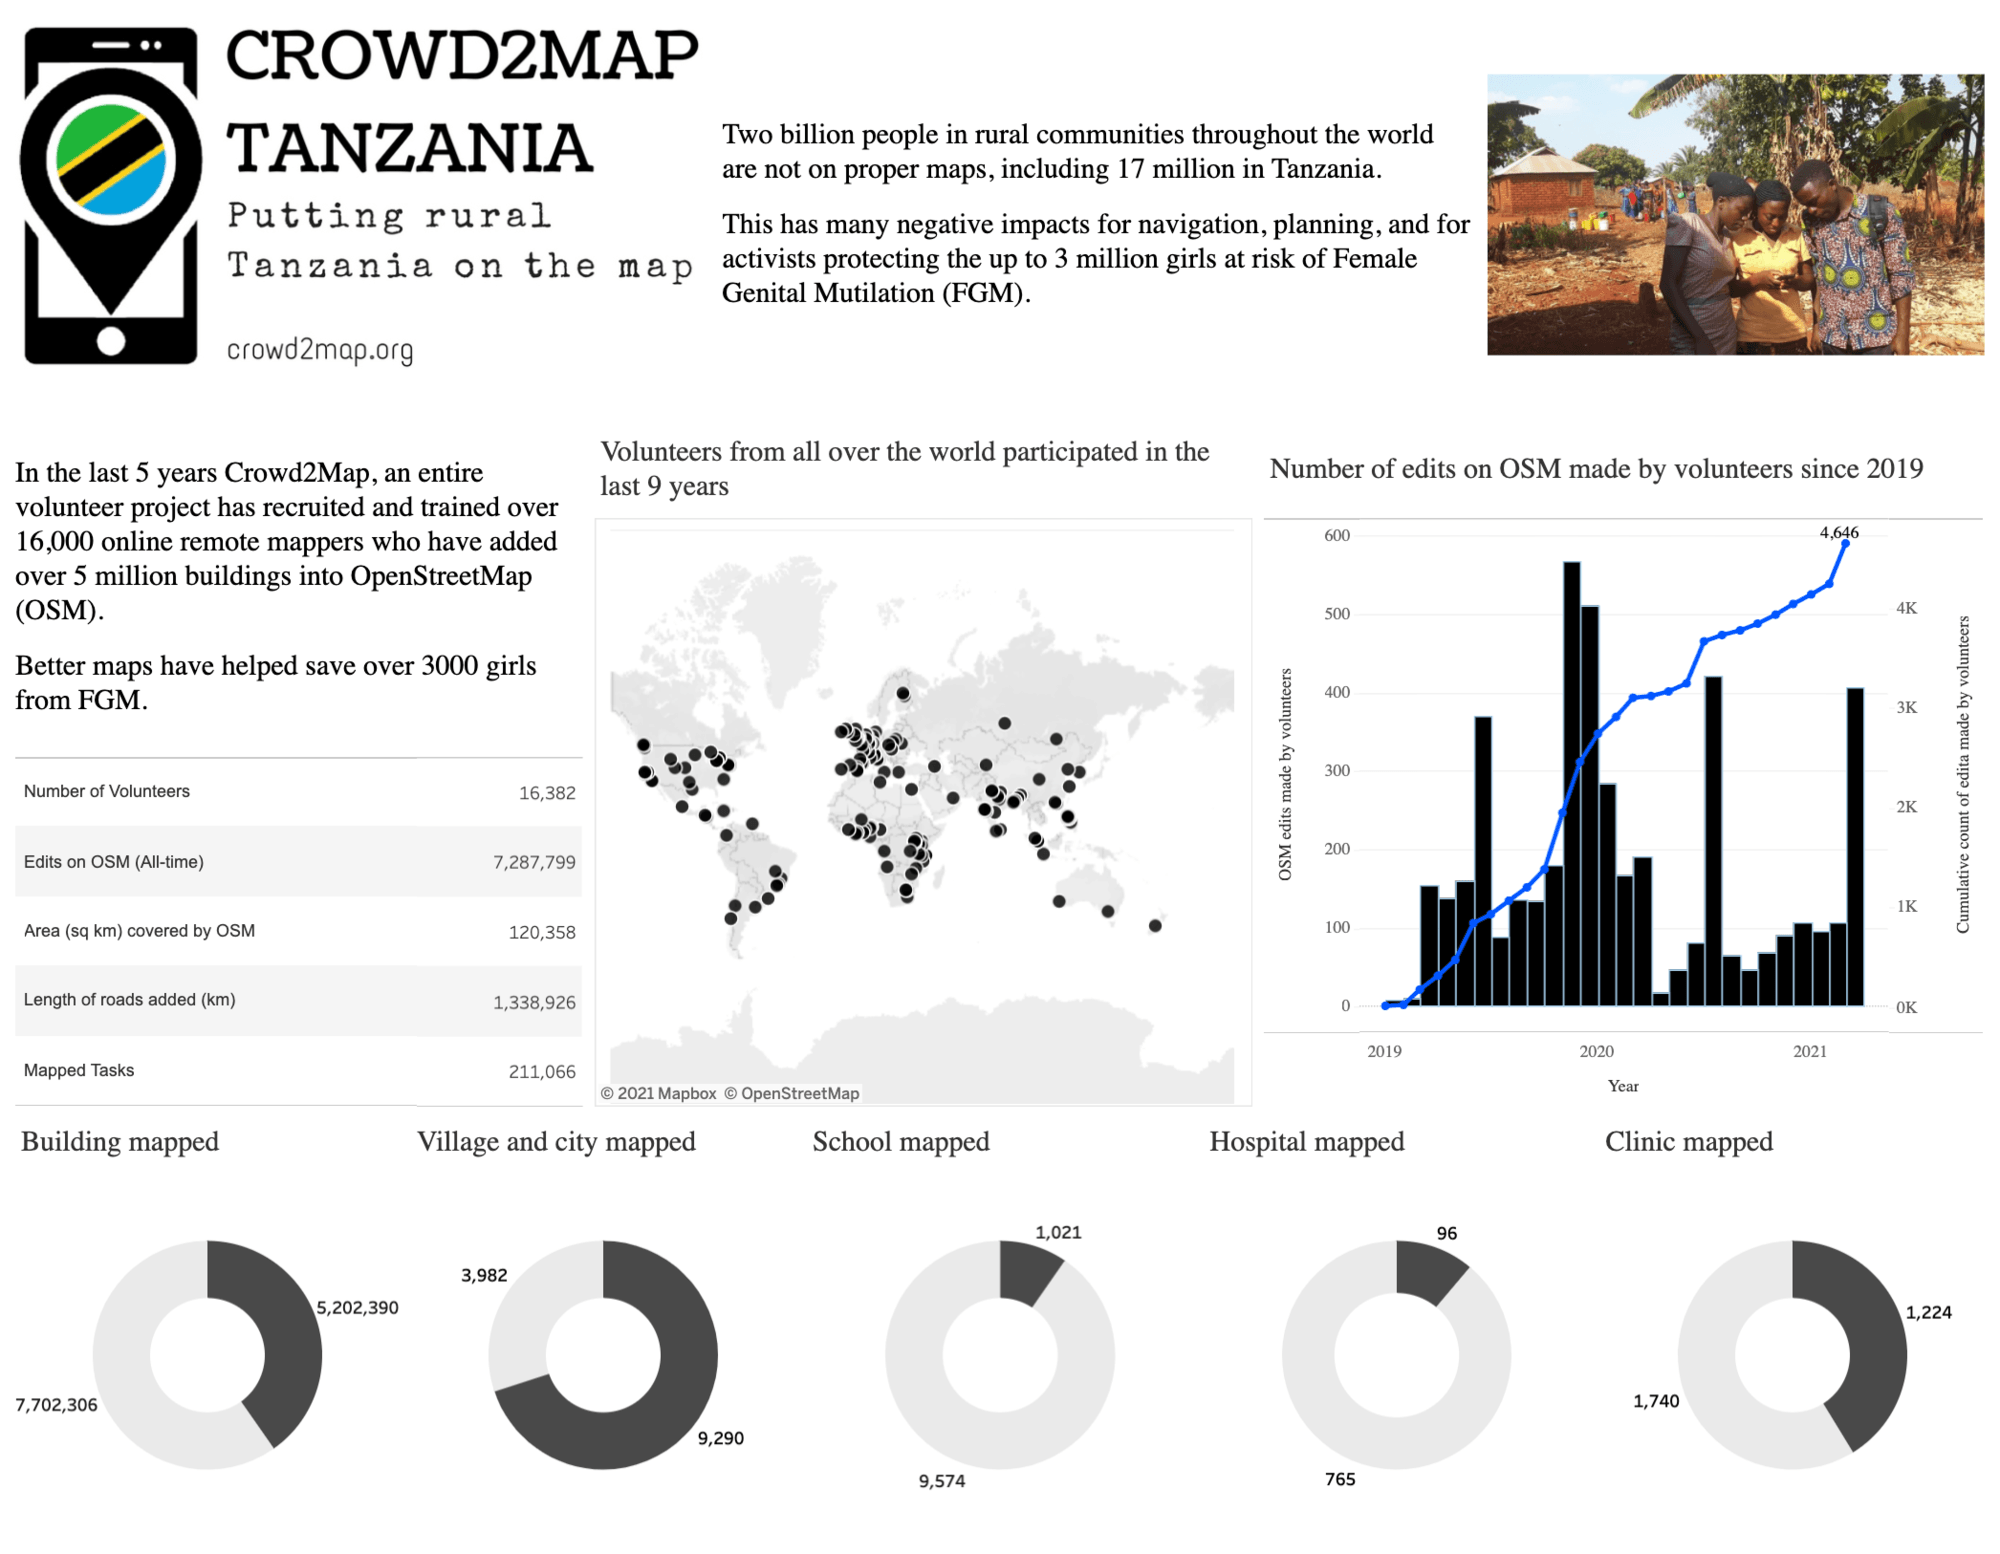
- Socialviz Crowd2Map Project Mari Takashima
- My Spotify (10/5/20 - 10/5/21) Aloysius Ong
- Shadow and Bone: transcript analysis Ausrine Rimeikyte
Community Project Updates

Makeover Monday
Join the community every Monday to work with a given data set and create better, more effective visualizations.
Web: Makeover Monday
Twitter: #MakeoverMonday
Week 20: What animal could you beat in a fight?
Workout Wednesday
Build your skills with a weekly challenge to re-create an interactive data visualization.
Web: Workout Wednesday
Twitter: #WOW2021
Week 20: Can you compare Same Day to a Selected Date?
Sports Viz Sunday
Create and share data visualizations using rich, sports-themed data sets in a monthly challenge.
Web: Sports Viz Sunday
Twitter: #SportsVizSunday
May 2021: Kentucky Derby
Iron Quest
Practice data sourcing, preparation, and visualization skills in a themed monthly challenge.
Web: Iron Quest
Twitter: #IronQuest
April 2021: Diversity in Entertainment
Storytelling with Data
Practice data visualization and storytelling skills by participating in monthly challenges and exercises.
Web: Storytelling with Data
Twitter: #SWDChallenge
May 2021: how we've grown
Project Health Viz
Uncover new stories by visualizing healthcare data sets provided each month.
Web: Project Health Viz
Twitter: #ProjectHealthViz
May 2021: Registered Nursing Labor Stats (1998-2020)
SDG Viz Project
Visualize data about Sustainable Development Goals provided by the World Health Organization.
Web: SDG Viz Project
Twitter: #TheSDGVizProject
Goal 16: Peace, Justice, and Strong Institutions
Preppin' Data
A weekly challenge to help you learn to prepare data and use Tableau Prep.
Web: Preppin’ Data
Twitter: #PreppinData
2021 Week 20: Controlling Complaints
Real World Fake Data
Create business dashboards using provided data sets for various industries and departments.
Web: Real World Fake Data
Twitter: #RWFD
Dataset #11: Hospitality
Viz 2 Educate
Each month, create vizzes on global education syllabus topics as resources for teachers worldwide.
Web: Viz 2 Educate
Twitter: #Viz2educate
April: Arts & Music
Viz for Social Good
Volunteer to design data visualizations that help nonprofits harness the power of data for social change.
Web: Viz for Social Good
Twitter: #VizforSocialGood
April 22 - May 20, 2021: Crowd2Map
Diversity in Data
An initiative centered around diversity, equity & awareness by visualizing provided datasets each month.
Web: Diversity in Data
Twitter: #DiversityinData
Related Stories

DataFam Roundup: February 24-28, 2025

DataFam Roundup: February 17-21, 2025

DataFam Roundup: February 10-14, 2025
Subscribe to our blog
Get the latest Tableau updates in your inbox.