DataFam Roundup: May 10 - May 14, 2021


Dig into the latest DataFam Roundup—a weekly blog post that brings together what’s trending in the community all in one post. As always, we invite you to send us your content—and the DataFam content from your peers that have inspired you! Find the content submission form here.
DataFam content
Iron Quest History – Recap, Sarah Bartlett
Dive into content created by the Tableau Community:
- 5 Things Salesforce Admins Should Know About Tableau Adam Mico
- Viz Journal | Chess Priya Padham
- Ten Tips including "Create a Hex Map Without Adding a Data Source" Kevin Flerlage
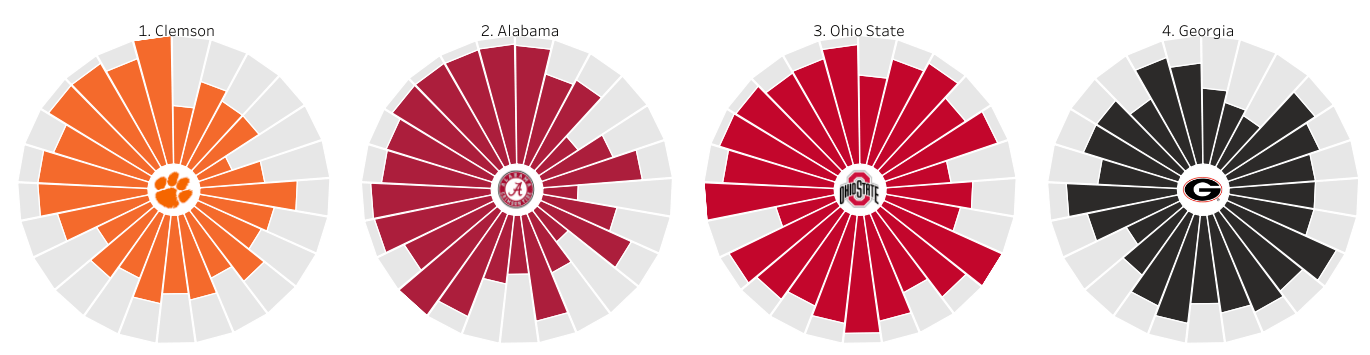
- Florence Nightingale's Famous Rose Chart (aka "Coxcomb") Robert Kosara
- Bye Bye Baby Blues Jade Wimpey
- Iron Quest History – Recap Sarah Bartlett
- Tableau and Equal Measures 2030 Data Fellowship Launch
- Forecast Tips Jeffrey A. Shaffer
- Why Dashboards Fail and What You Can Do To Ensure They Succeed VizConnect
- Makeover Monday|参加方法・メリット・活用例を解説/ Explaining how to participate, merits, and usage examples in Japanese Data Viz Lab
- How can I Animate a Visualisation in Tableau? The Information Lab
- No Python? No Problem. The Secret to Living Connections on Tableau Public Eric Parker
- The Tableau Certified Associate Consultant Exam 2021 Tim Ngwena
Upcoming events
DataDev Day
Join an upcoming Tableau User Group event:
- May 20, 2021: Super TUG with Francois!
- May 21, 2021: Tableau Server Admin User Group
- May 26, 2021: Data+Women Speak Up!
Check out all the virtual Tableau User Group events here.
May 20, 2021 Tableau’s first DataDev Day: We’re excited to announce a new, one-day event dedicated to DataDevs and anyone interested in or using the Tableau developer platform to create integrations and customize Tableau for their organizations.
Follow Joy Rios and Shereese Maynard from The HIT Like a Girl podcast team as they spend the summer touring the country meeting up with women in the health IT and extended healthcare communities to reconnect and offer support after a most difficult year. Focusing their content on maternal health and mindfulness, they'll be collecting data and sharing technology, exercises, and regional stats. Follow their journey on Twitter, and learn more on their site.
Vizzes
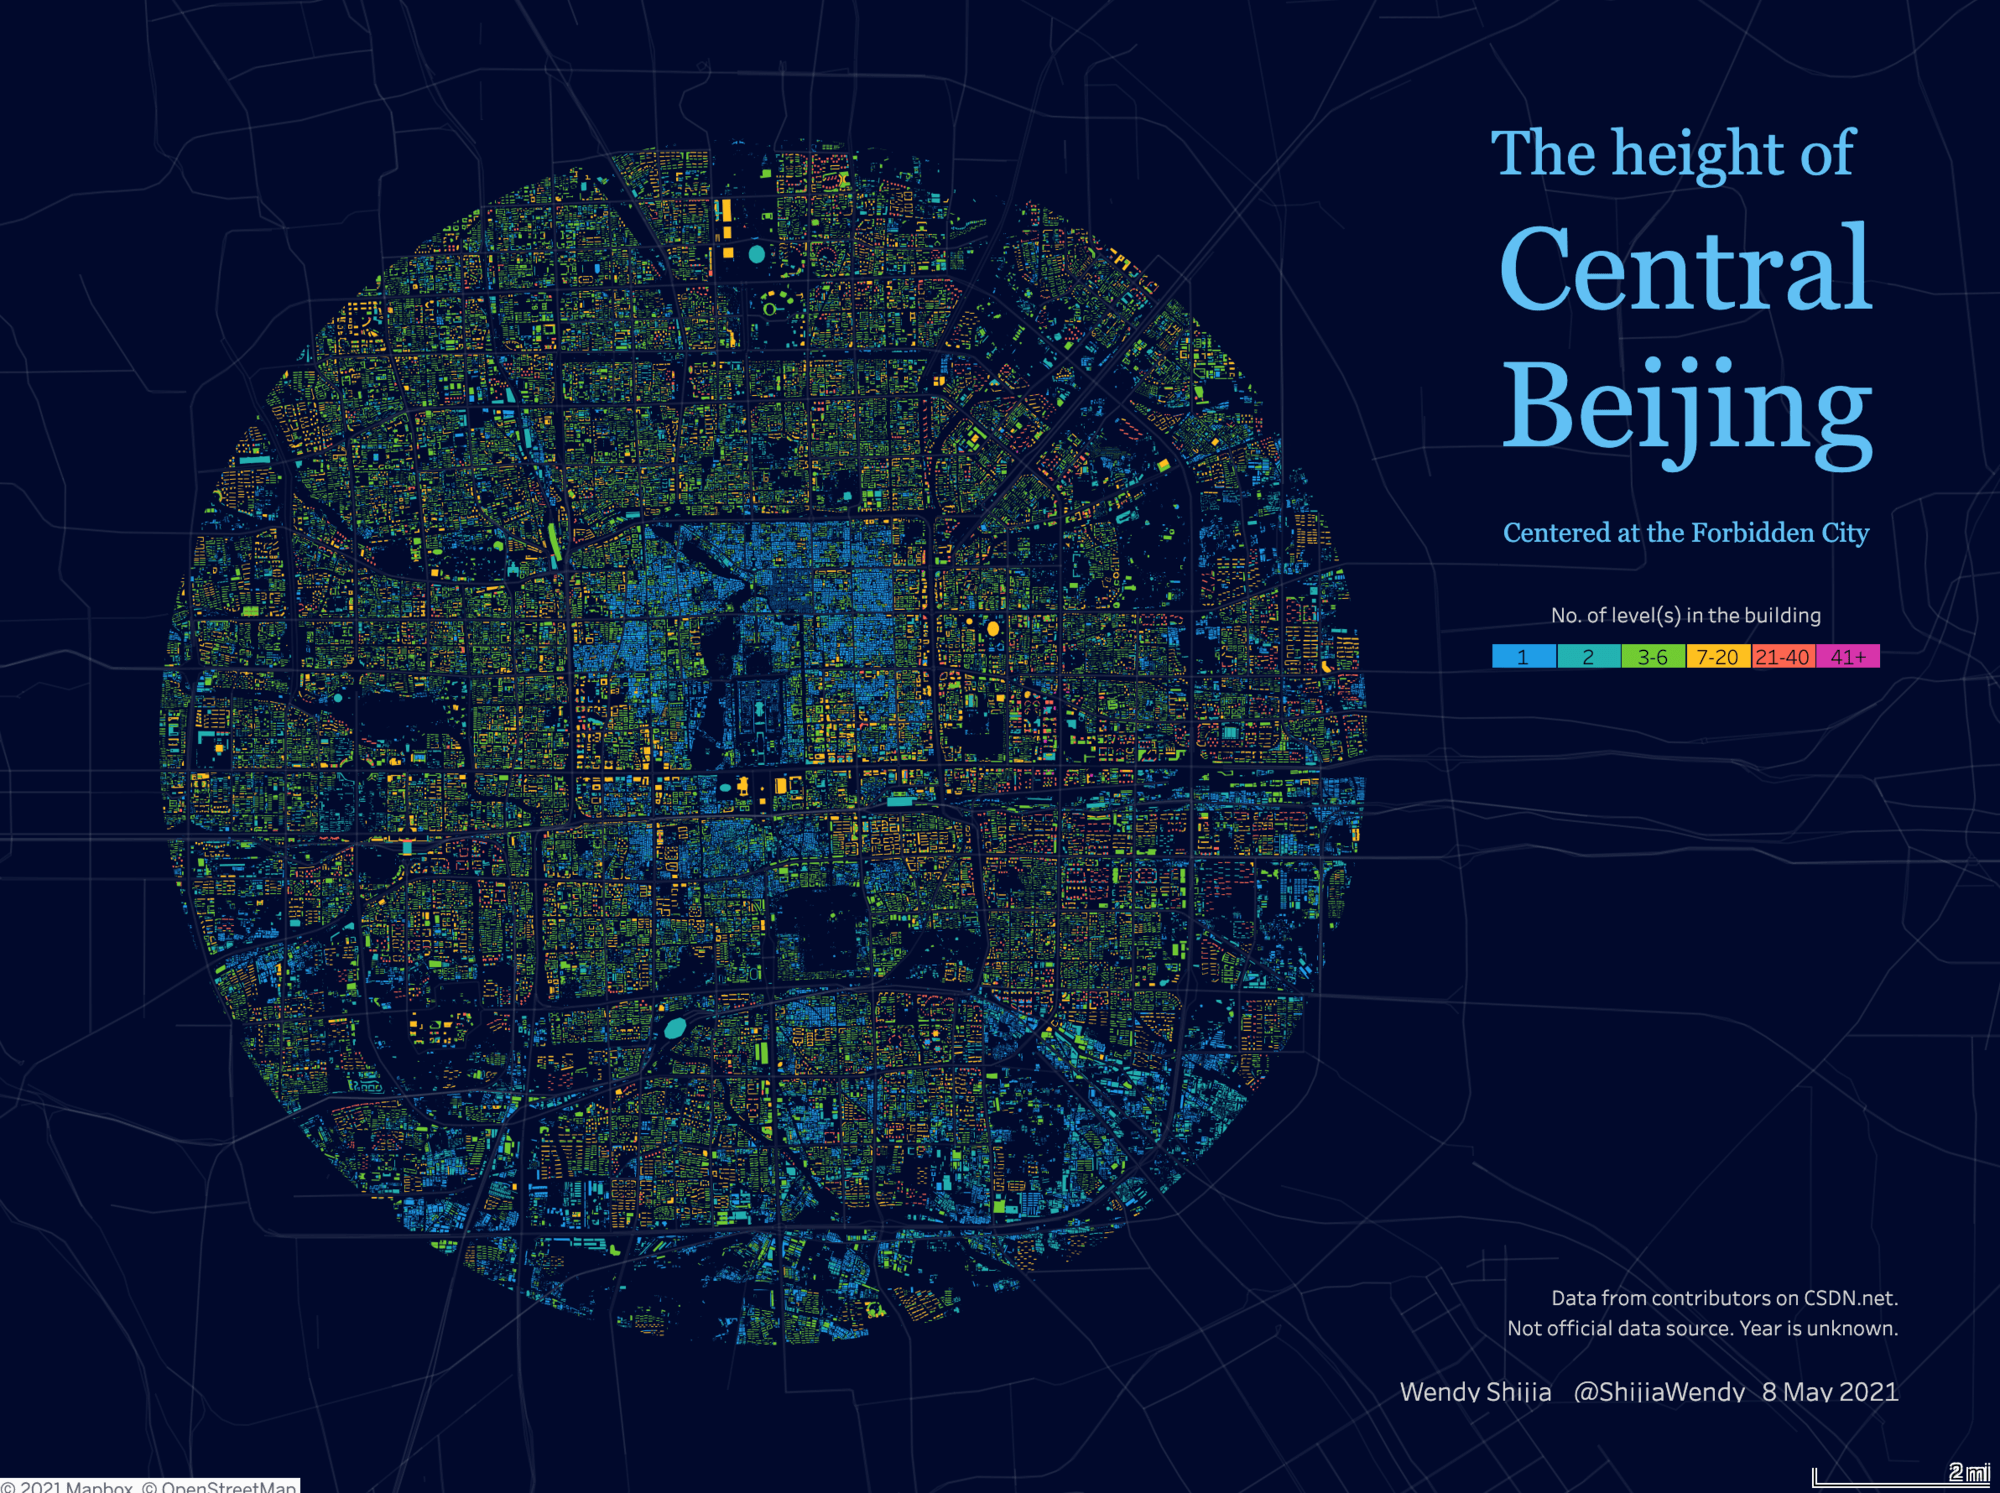
The Height of Central Beijing, Wendy Shijia
Catch this week’s Viz of the Days here and subscribe to get them emailed directly to your inbox.
Check out some inspirational vizzes created by the community:
- The Height of Central Beijing Wendy Shijia
- The Gutenberg Diagram | Principles of Design in Dataviz Will Sutton
- Tableau Tips: How to assign shapes correctly in Tableau? Priyanka Dobhal
- The Coffees of Twin Peaks Judit Bekker
- What it takes to become a NASA Astronaut Vinodh Kumar
- US Nursing Salaries 1998-2020 - #ProjectHealthViz Lindsay Betzendahl
Community Projects

Stay in the loop on the Tableau Community Projects:
Makeover Monday
Join the community every Monday to work with a given data set and create better, more effective visualizations.
Web: Makeover Monday
Twitter: #MakeoverMonday
Week 19: What Does 1GB of Mobile Data Cost in Every Country?
Workout Wednesday
Build your skills with a weekly challenge to re-create an interactive data visualization.
Web: Workout Wednesday
Twitter: #WOW2021
Week 19: Regional Sales Readout
Sports Viz Sunday
Create and share data visualizations using rich, sports-themed data sets in a monthly challenge.
Web: Sports Viz Sunday
Twitter: #SportsVizSunday
May 2021: Kentucky Derby
Iron Quest
Practice data sourcing, preparation, and visualization skills in a themed monthly challenge.
Web: Iron Quest
Twitter: #IronQuest
April 2021: Diversity in Entertainment
Storytelling with Data
Practice data visualization and storytelling skills by participating in monthly challenges and exercises.
Web: Storytelling with Data
Twitter: #SWDChallenge
May 2021: how we've grown
Project Health Viz
Uncover new stories by visualizing healthcare data sets provided each month.
Web: Project Health Viz
Twitter: #ProjectHealthViz
May 2021: Registered Nursing Labor Stats (1998-2020)
SDG Viz Project
Visualize data about Sustainable Development Goals provided by the World Health Organization.
Web: SDG Viz Project
Twitter: #TheSDGVizProject
Goal 16: Peace, Justice, and Strong Institutions
Preppin' Data
A weekly challenge to help you learn to prepare data and use Tableau Prep.
Web: Preppin’ Data
Twitter: #PreppinData
2021 Week 19: Prep Air Project Details
Real World Fake Data
Create business dashboards using provided data sets for various industries and departments.
Web: Real World Fake Data
Twitter: #RWFD
Dataset #11: Solar Energy
Viz 2 Educate
Each month, create vizzes on global education syllabus topics as resources for teachers worldwide.
Web: Viz 2 Educate
Twitter: #Viz2educate
April: Arts & Music
Viz for Social Good
Volunteer to design data visualizations that help nonprofits harness the power of data for social change.
Web: Viz for Social Good
Twitter: #VizforSocialGood
April 22 - May 20, 2021: Crowd2Map
Diversity in Data
An initiative centered around diversity, equity & awareness by visualizing provided datasets each month.
Web: Diversity in Data
Twitter: #DiversityinData
Related Stories

DataFam Roundup: February 24-28, 2025

DataFam Roundup: February 17-21, 2025

DataFam Roundup: February 10-14, 2025
Subscribe to our blog
Get the latest Tableau updates in your inbox.