DataFam Roundup: July 29– August 2, 2024


Welcome! Dig into this week's DataFam Roundup—a weekly blog that brings together community content all in one post. As always, we invite you to send us your content—and the DataFam content from your peers that have inspired you! Find the content submission form here.
Community Highlight
To recognize new and consistent Tableau contributors—we’re excited to have a section within the weekly DataFam Roundup called the Tableau Community Highlight. Find out how to get involved.

Lilla Rasztik, Lead BI Analyst
Amsterdam, Netherlands
Lilla Rasztik is a Lead BI Analyst. She has been working with various data tools for more than ten years but got started with Tableau in 2021. Due to public health regulations at the time, Lilla felt disengaged and as though she lacked a community. After making a new year’s resolution to learn Tableau, Lilla was pleasantly surprised to find countless opportunities to connect with people in a virtual environment, fulfilling her desire for community as well. After participating in her first Makeover Monday challenge, Tableau became a new hobby and passion for Lilla.
As an active publisher of vizzes on Tableau Public, Lilla is inspired by art and other media she sees online. As for the data, she finds inspiration in her daily life, if she finds something that interests her, she starts to collect data. A recent example of this was when Lilla moved to a new city and talked with some of her neighbors about the history of the region. Fascinated by what she learned, she created a dataset which then turned into a viz.
Connect with Lilla on Linkedin, X, and Tableau Public.
DataFam content
Dive into content created by the Tableau Community:
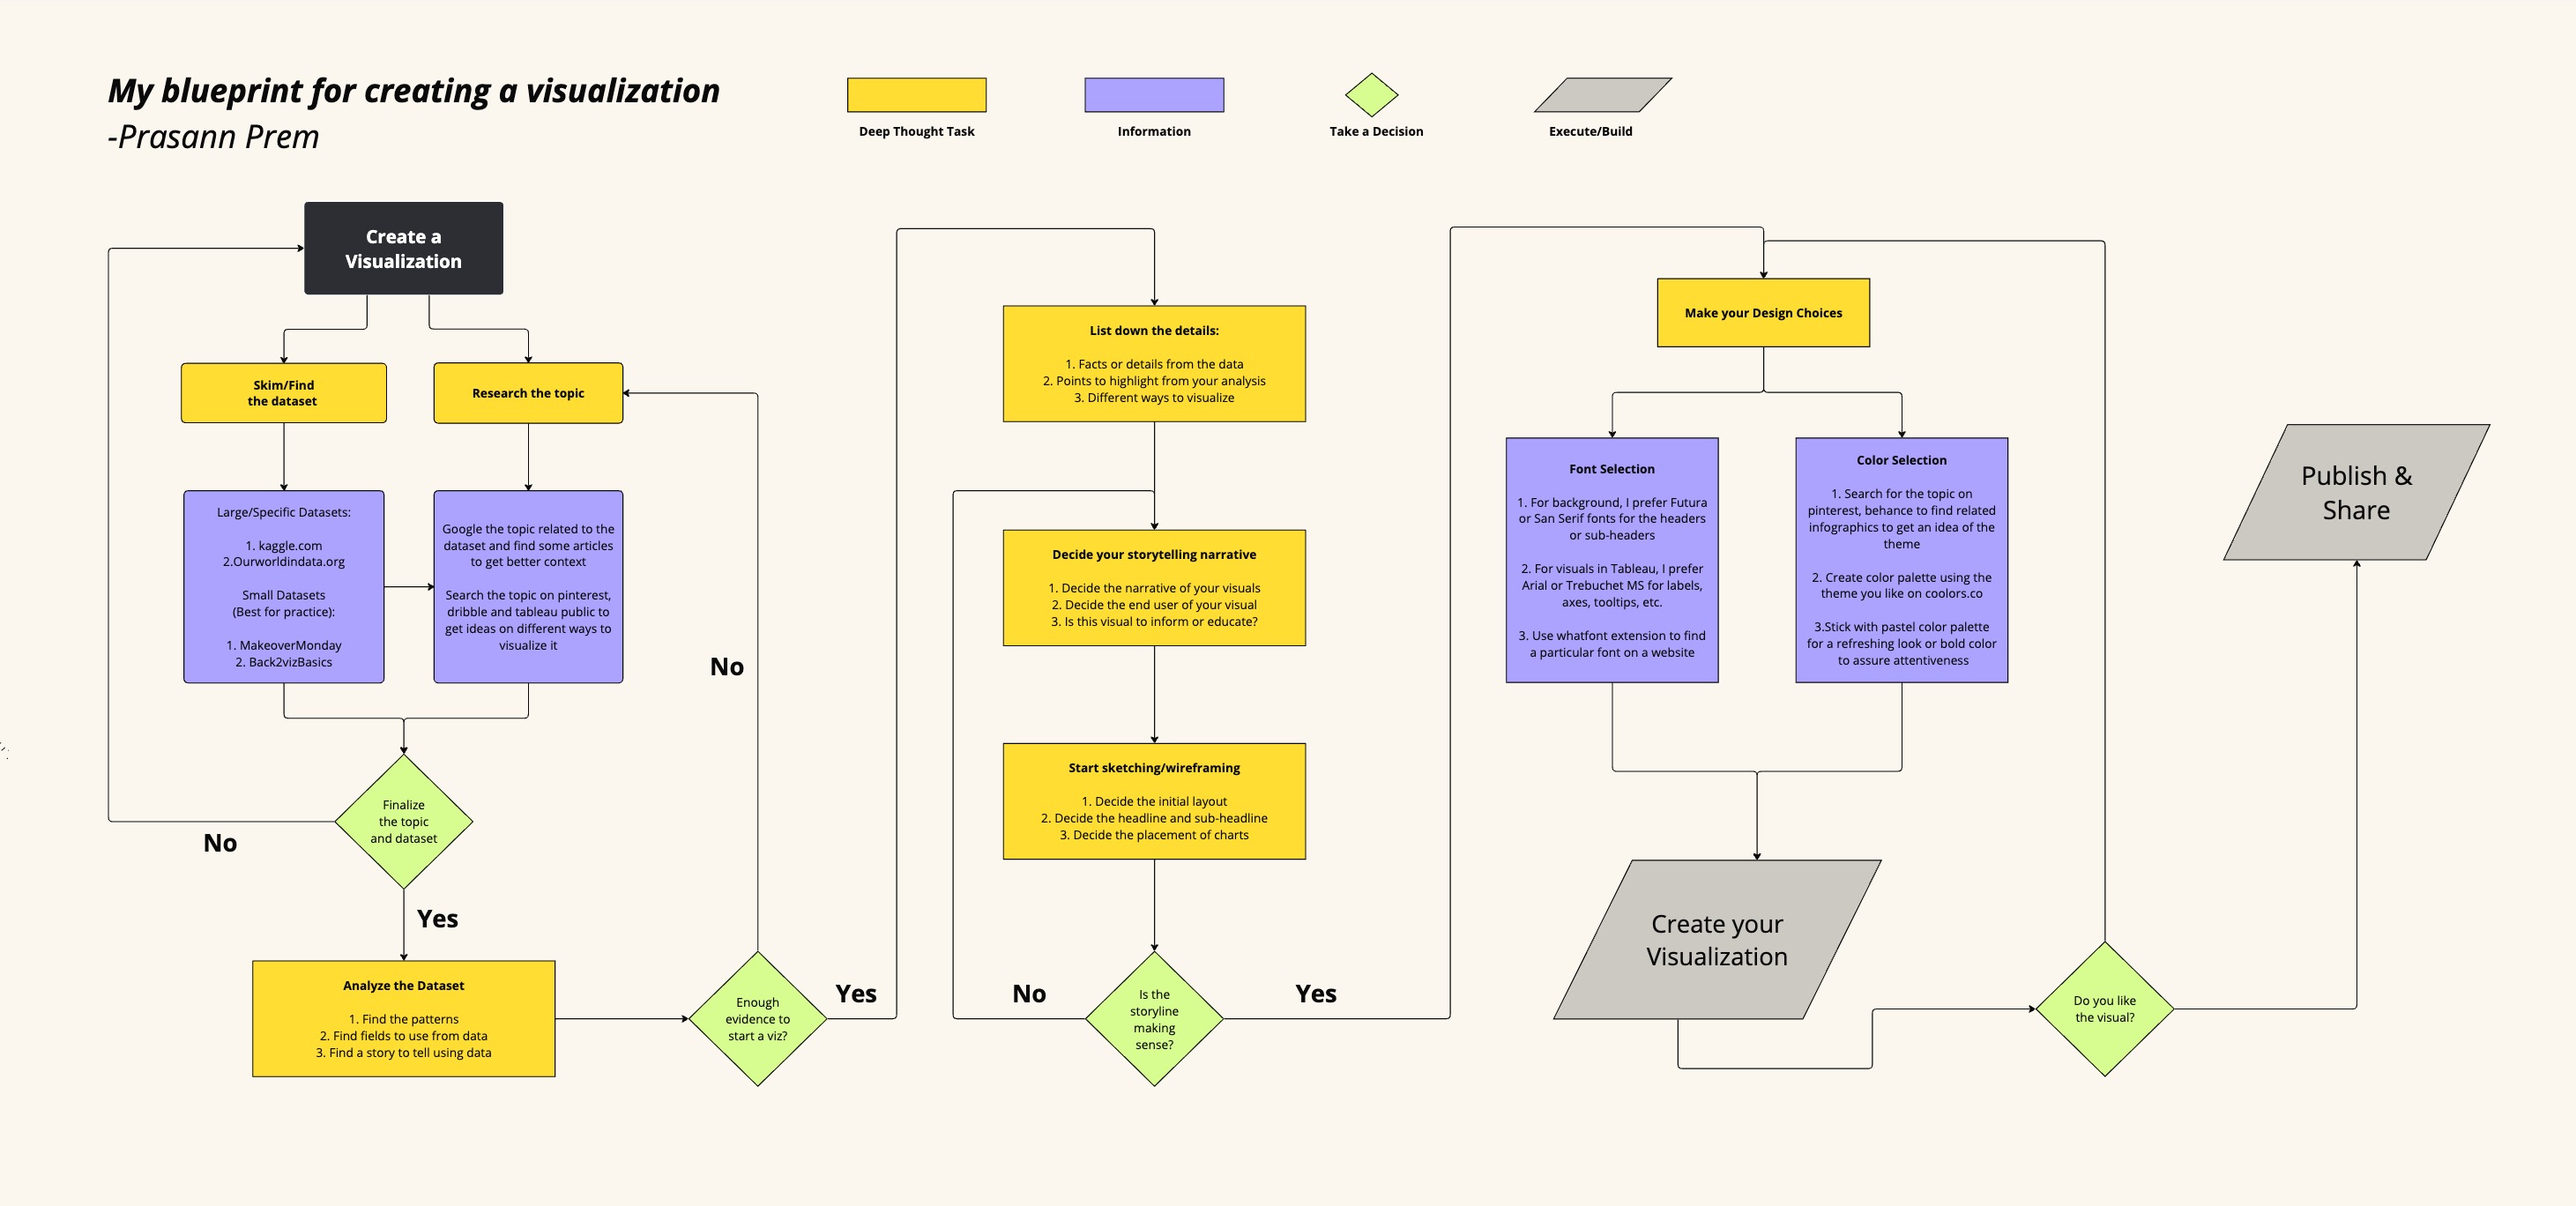
Prasann Prem: My simple process each time I create a visualization!
- Tanya Lomskaya: My no-code way to label any radial in Tableau
- Harim Jung, Visual Climate: How to build a Marimekko chart in 5 minutes
- Prasann Prem: My simple process each time I create a visualization!
- Louis Yu: Secrets of the Viz: Celebrating Pride Month Part 2
- Steve Adams: Gut Instincts
Shortcut
Team Tableau
- 5 Tips from a Data Career Mentor
- Winning with Tableau: Paul Ross’s Tips from Beginner to Iron Viz Champion
- Extend Your Visual Analytics with Tableau Viz Extensions
Upcoming events and community participation
- Dreamin' in Data Dreamin’ in Data is the first Salesforce Community Conference purpose-built to help showcase the entire journey of your organization’s data, from Salesforce (your CRM), through integrations with other applications (using MuleSoft), and finally to analysis and determining the story your data is telling (using Tableau) – ultimately to help your organization make smarter decisions faster and stay ahead of your competition.
- Mark your calendars and join the Data Book Club as we explore, Chart Spark by Alli Torban, and the book's key themes and practical applications in our professional and personal lives. We will be meeting virtually starting August 2nd at 11am CT, but we also have a Slack space to discuss the book asynchronously as well as share notes, ideas, and resources!
- Contest Announcement with the AI + Tableau User Group: Create our Logo and Banner with AI! We’re excited to announce a contest for creating a new logo and banner for our community!
- CRM Analytics Community Office Hours! Have CRM Analytics questions? Want to know how to work with data? Want to learn something new? Have visualization ideas you want to share or need feedback on? Want to just hang out with a bunch of us? Come join us (virtual)!
- Lights, Camera, Action: Tableau and IMDb Launch Data Visualization Campaign for Movie Lovers
- DataFam Birthday Roundup! In the effort of continuing support for one another, we thought it would be fun to gather data on DataFam birthdays! If you're willing, could you let us know which day you celebrate your birthday? Just go ahead and pick the day from this year's calendar, since it's a leap year and all possible days are available to choose from!
- Mentorship Program by the Data Visualization Society
- Women in Dataviz Virtual Coffee Breaks: Held every sixth Thursday morning and every sixth Wednesday afternoon in the EST time zone, Virtual Coffee Breaks are a casual networking event. Feel free to drop in and out as you need toduring the hour, and stay for as little time or as long as you want.
Vizzes
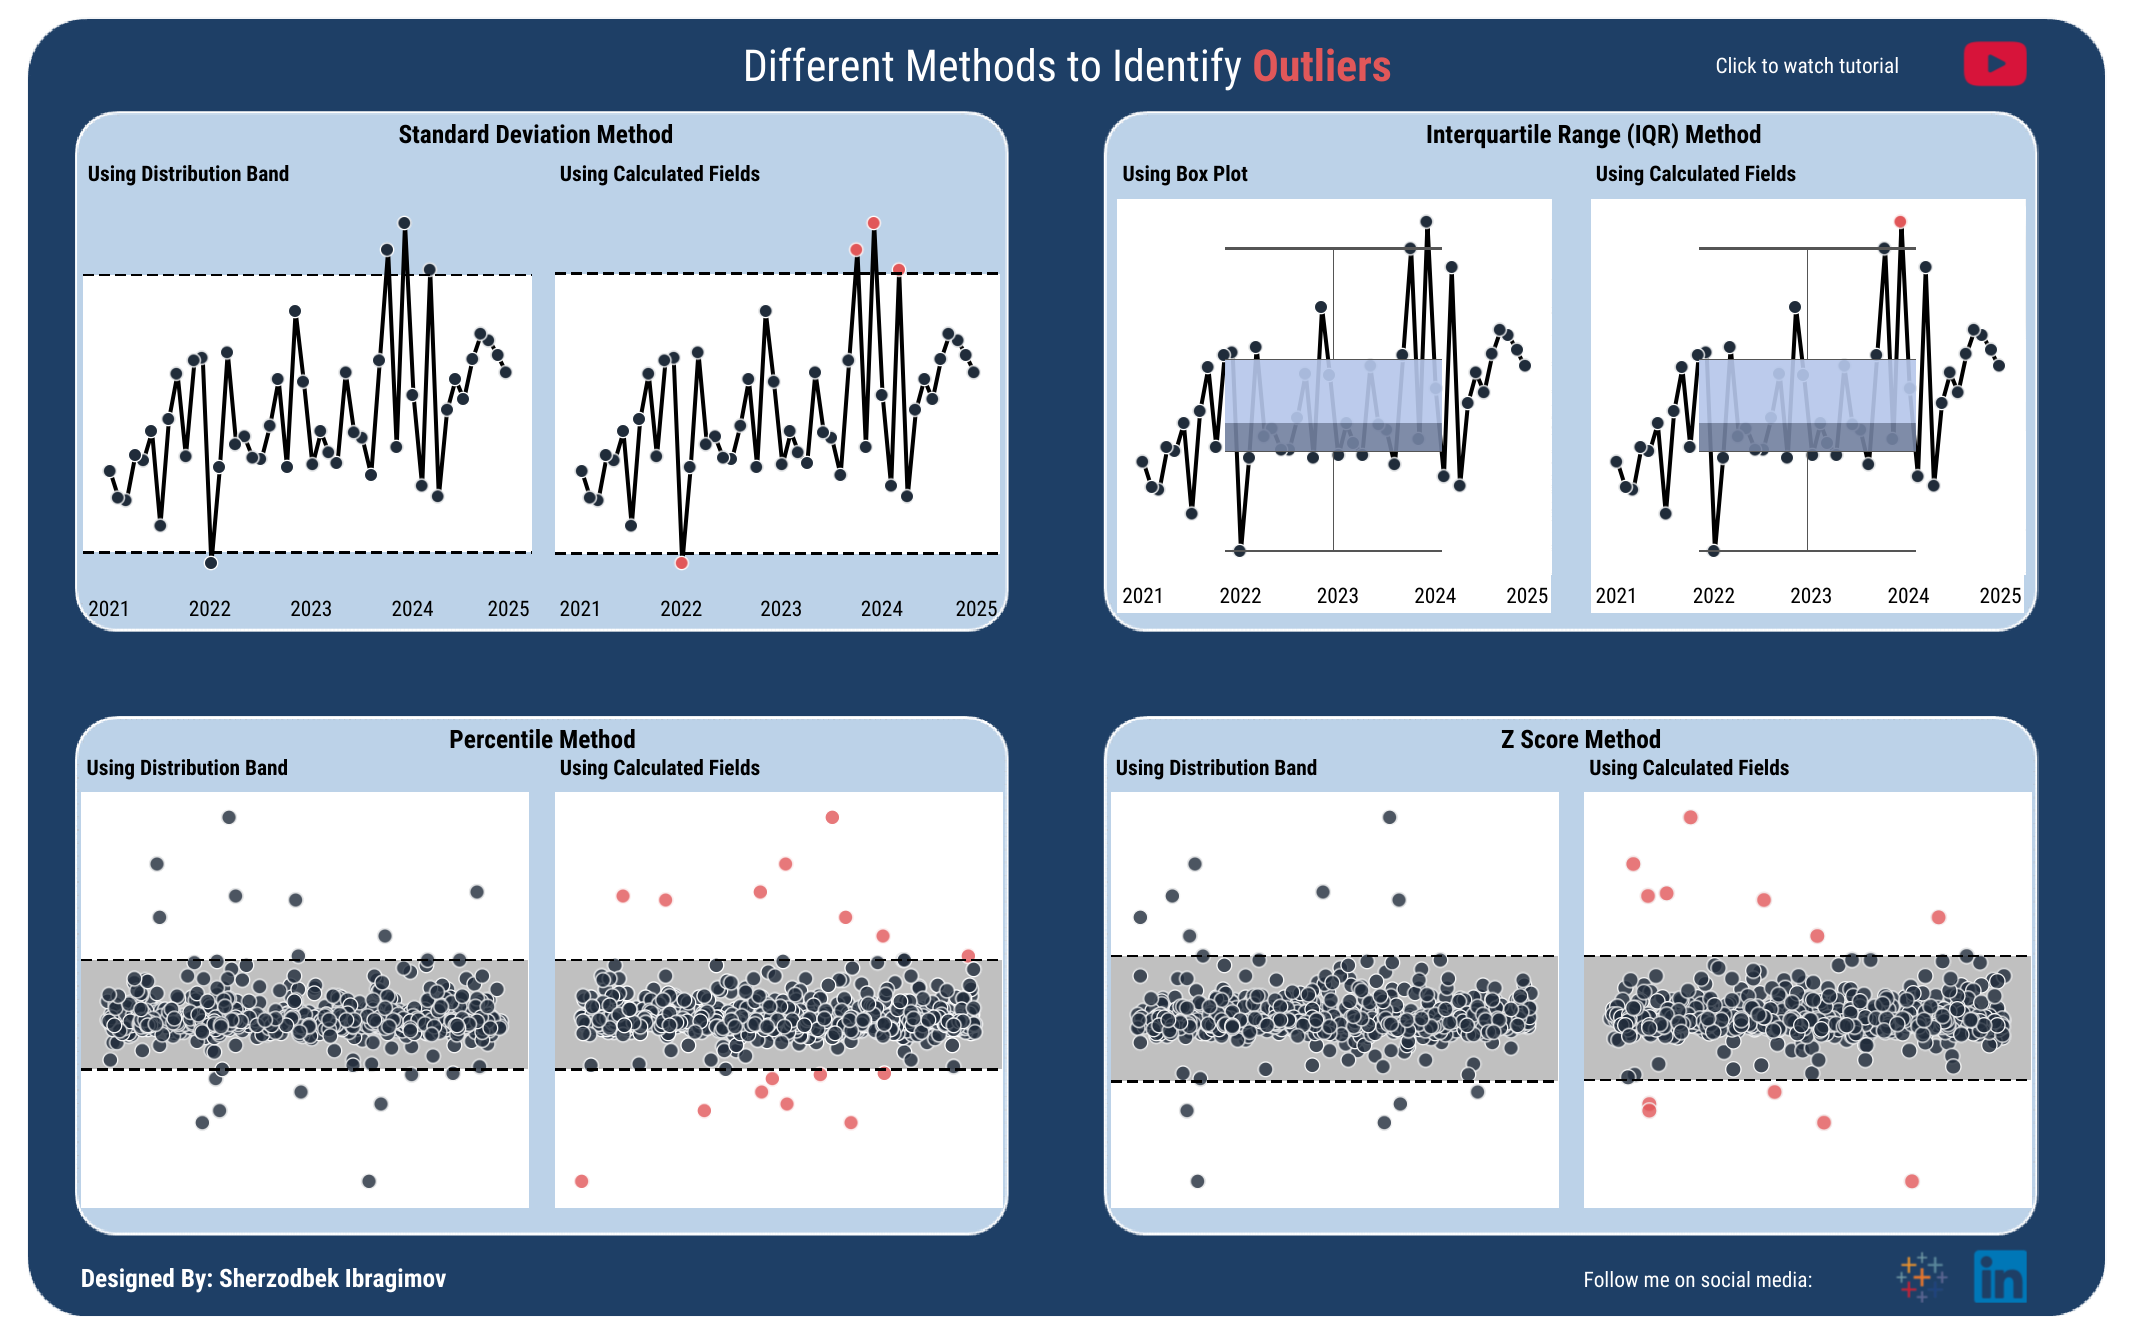
Sherzodbek Ibragimov: Different Methods to Identify Outliers
See the latest Viz of the Day, trending vizzes, featured authors, and more on Tableau Public.
Check out some inspirational vizzes created by the community:
- Anastasiia Kuznetsova: Dashboard Template
- Victor Muñoz: 30 Days of Nature in Bansko
- Will Sutton:
- Jibril Mohamed: French people are losing confidence in the Paris Olympics | #MakeoverMonday
- Sebastine Amede:
- Jay Charole: The Rise of Lego Licensing
- Sherzodbek Ibragimov: Different Methods to Identify Outliers
- Arshi Saleh: The True Cost of Fashion - #VizforSocialGood | #FutureFriday
- Veronica Simoes: Queimadas no Brasil
Community Projects
Back 2 Viz Basics
A bi-weekly project helping those who are newer in the community and just starting out with Tableau. Not limited just to newbies!
Web: Back 2 Viz Basics
X: #B2VB
Week 15: Design a Landing Page
Workout Wednesday
Build your skills with a weekly challenge to re-create an interactive data visualization.
Web: Workout Wednesday
X: #WOW2022
Week 31: How do you compare against the world’s best 100m runners?
Preppin' Data
A weekly challenge to help you learn to prepare data and use Tableau Prep.
Web: Preppin’ Data
X: #PreppinData
Week 31: Olympics Special
Makeover Monday
Create business dashboards using provided data sets for various industries and departments.
Web: Makeover Monday
X: #MakeoverMonday
Week 31: The Most Innovative Companies of 2024
Visual Climate
Collaborate and share climate data.
Web: Visual Climate
X: #VisualClimate
Gender Equality_ Women Entrepreneurship Participation
DataFam Con
A monthly challenge covering pop culture and fandoms.
Web: DataFam Con
X: #DataFamCon
March 2024 Challenge: Sports Movies Edition
EduVizzers
A monthly project connecting real education data with real people.
Web: Eduvizzers
July 2024: Texas Education Agency
Viz for Social Good
Volunteer to design data visualizations that help nonprofits harness the power of data for social change.
Web: Viz for Social Good
X: #VizforSocialGood
July 5 - 26: Future Fridays
Games Night Viz
A monthly project focusing on using data from your favorite games.
Web: Games Nights Viz
X: #GamesNightViz
Season 2: Cooking up the Spice of Data
Iron Quest
Practice data sourcing, preparation, and visualization skills in a themed monthly challenge.
Web: Iron Quest
X: #IronQuest
Iron Quest – Maps II
Storytelling with Data
Practice data visualization and storytelling skills by participating in monthly challenges and exercises.
Web: Storytelling with Data
X: #SWDChallenge
July 2024: graphing for—or with—kids
Project Health Viz
Uncover new stories by visualizing healthcare data sets provided each month.
Web: Project Health Viz
X: #ProjectHealthViz
Diversity in Data
An initiative centered around diversity, equity & awareness by visualizing provided datasets each month.
Web: Diversity in Data
X: #DiversityinData
Sports Viz Sunday
Create and share data visualizations using rich, sports-themed data sets in a monthly challenge.
Web: Sports Viz Sunday
X: #SportsVizSunday
Real World Fake Data
Create business dashboards using provided data sets for various industries and departments.
Web: Real World Fake Data
X: #RWFD
2024 - Admin Insights
Data Plus Music
A monthly project visualizing the data behind the music we love!
Web: Data Plus Music
X: #DataPlusMusic
Related Stories

DataFam Roundup: February 17-21, 2025

DataFam Roundup: February 10-14, 2025

Announcing the 2025 Tableau Visionaries
 February 13, 2025
Subscribe to our blog
Get the latest Tableau updates in your inbox.