DataFam Roundup: July 15–19, 2024


Welcome! Dig into this week's DataFam Roundup—a weekly blog that brings together community content all in one post. As always, we invite you to send us your content—and the DataFam content from your peers that have inspired you! Find the content submission form here.
Community Highlight
To recognize new and consistent Tableau contributors—we’re excited to have a section within the weekly DataFam Roundup called the Tableau Community Highlight. Find out how to get involved.

Waleed Elhardallou, Founder of EventsTags
Stockholm, Sweden
Waleed Elhardallou is the Founder of EventsTags, a startup that aims to be a central hub for sharing insights about tech and business events in Sweden. While his background is in electrical engineering, his passion for digital marketing and web development led Waleed to self-learn Tableau. His journey with the tool started with the Tableau website and Trailblazer platform, then he attended Tableau and Salesforce events in Stockholm. Waleed solidified his skills with YouTube tutorials, Udemy courses, and tackling real-world problems from different industries.
As leader of the Stockholm Tableau User Group, Waleed recalls initially being drawn to the opportunity because of the scope for continuous learning and being surrounded by talented and passionate people. Waleed believes in the power of community and supportive environments and being a part of the Tableau community has allowed him to grow in his skills and connect with other Community Leaders. In addition to being involved in the Stockholm User Group, Waleed also contributes through his blog, where he documents his Tableau journey and insights.
Connect with Waleed on Linkedin, Tableau Public, and on his blog.
DataFam content
Dive into content created by the Tableau Community:
La Data Viz: Figma to Tableau
- Victor Muñoz: Facing Shyness with Data Art
- Make Impactful Data Viz + Conquer Fear of Public Speaking with Priya Padham
- La Data Viz: Figma to Tableau
- Anya Prosvetova: Building an Investment Portfolio Optimisation Tool with Python and Table Extensions in Tableau
- Shreya Arya: 8 TIPS to help you get started for #B2VB challenge
- Tanya Lomskaya: Creating unusual graphs in Tableau with the Graphviz flowchart algorithm
Team Tableau
- Build Your Data Analytics Portfolio with These 5 Essential Chart Types
- Winning with Tableau: Paul Ross’s Tips from Beginner to Iron Viz Champion
- Extend Your Visual Analytics with Tableau Viz Extensions
Upcoming events and community participation
- Dreamin' in Data Dreamin’ in Data is the first Salesforce Community Conference purpose-built to help showcase the entire journey of your organization’s data, from Salesforce (your CRM), through integrations with other applications (using MuleSoft), and finally to analysis and determining the story your data is telling (using Tableau) – ultimately to help your organization make smarter decisions faster and stay ahead of your competition.
- Mark your calendars and join the Data Book Club as we explore, Chart Spark by Alli Torban, and the book's key themes and practical applications in our professional and personal lives. We will be meeting virtually starting August 2nd at 11am CT, but we also have a Slack space to discuss the book asynchronously as well as share notes, ideas, and resources!
- Contest Announcement with the AI + Tableau User Group: Create our Logo and Banner with AI! We’re excited to announce a contest for creating a new logo and banner for our community!
- CRM Analytics Community Office Hours! Have CRM Analytics questions? Want to know how to work with data? Want to learn something new? Have visualization ideas you want to share or need feedback on? Want to just hang out with a bunch of us? Come join us (virtual)!
- Lights, Camera, Action: Tableau and IMDb Launch Data Visualization Campaign for Movie Lovers
- DataFam Birthday Roundup! In the effort of continuing support for one another, we thought it would be fun to gather data on DataFam birthdays! If you're willing, could you let us know which day you celebrate your birthday? Just go ahead and pick the day from this year's calendar, since it's a leap year and all possible days are available to choose from!
- Mentorship Program by the Data Visualization Society
- Women in Dataviz Virtual Coffee Breaks: Held every sixth Thursday morning and every sixth Wednesday afternoon in the EST time zone, Virtual Coffee Breaks are a casual networking event. Feel free to drop in and out as you need toduring the hour, and stay for as little time or as long as you want.
Vizzes
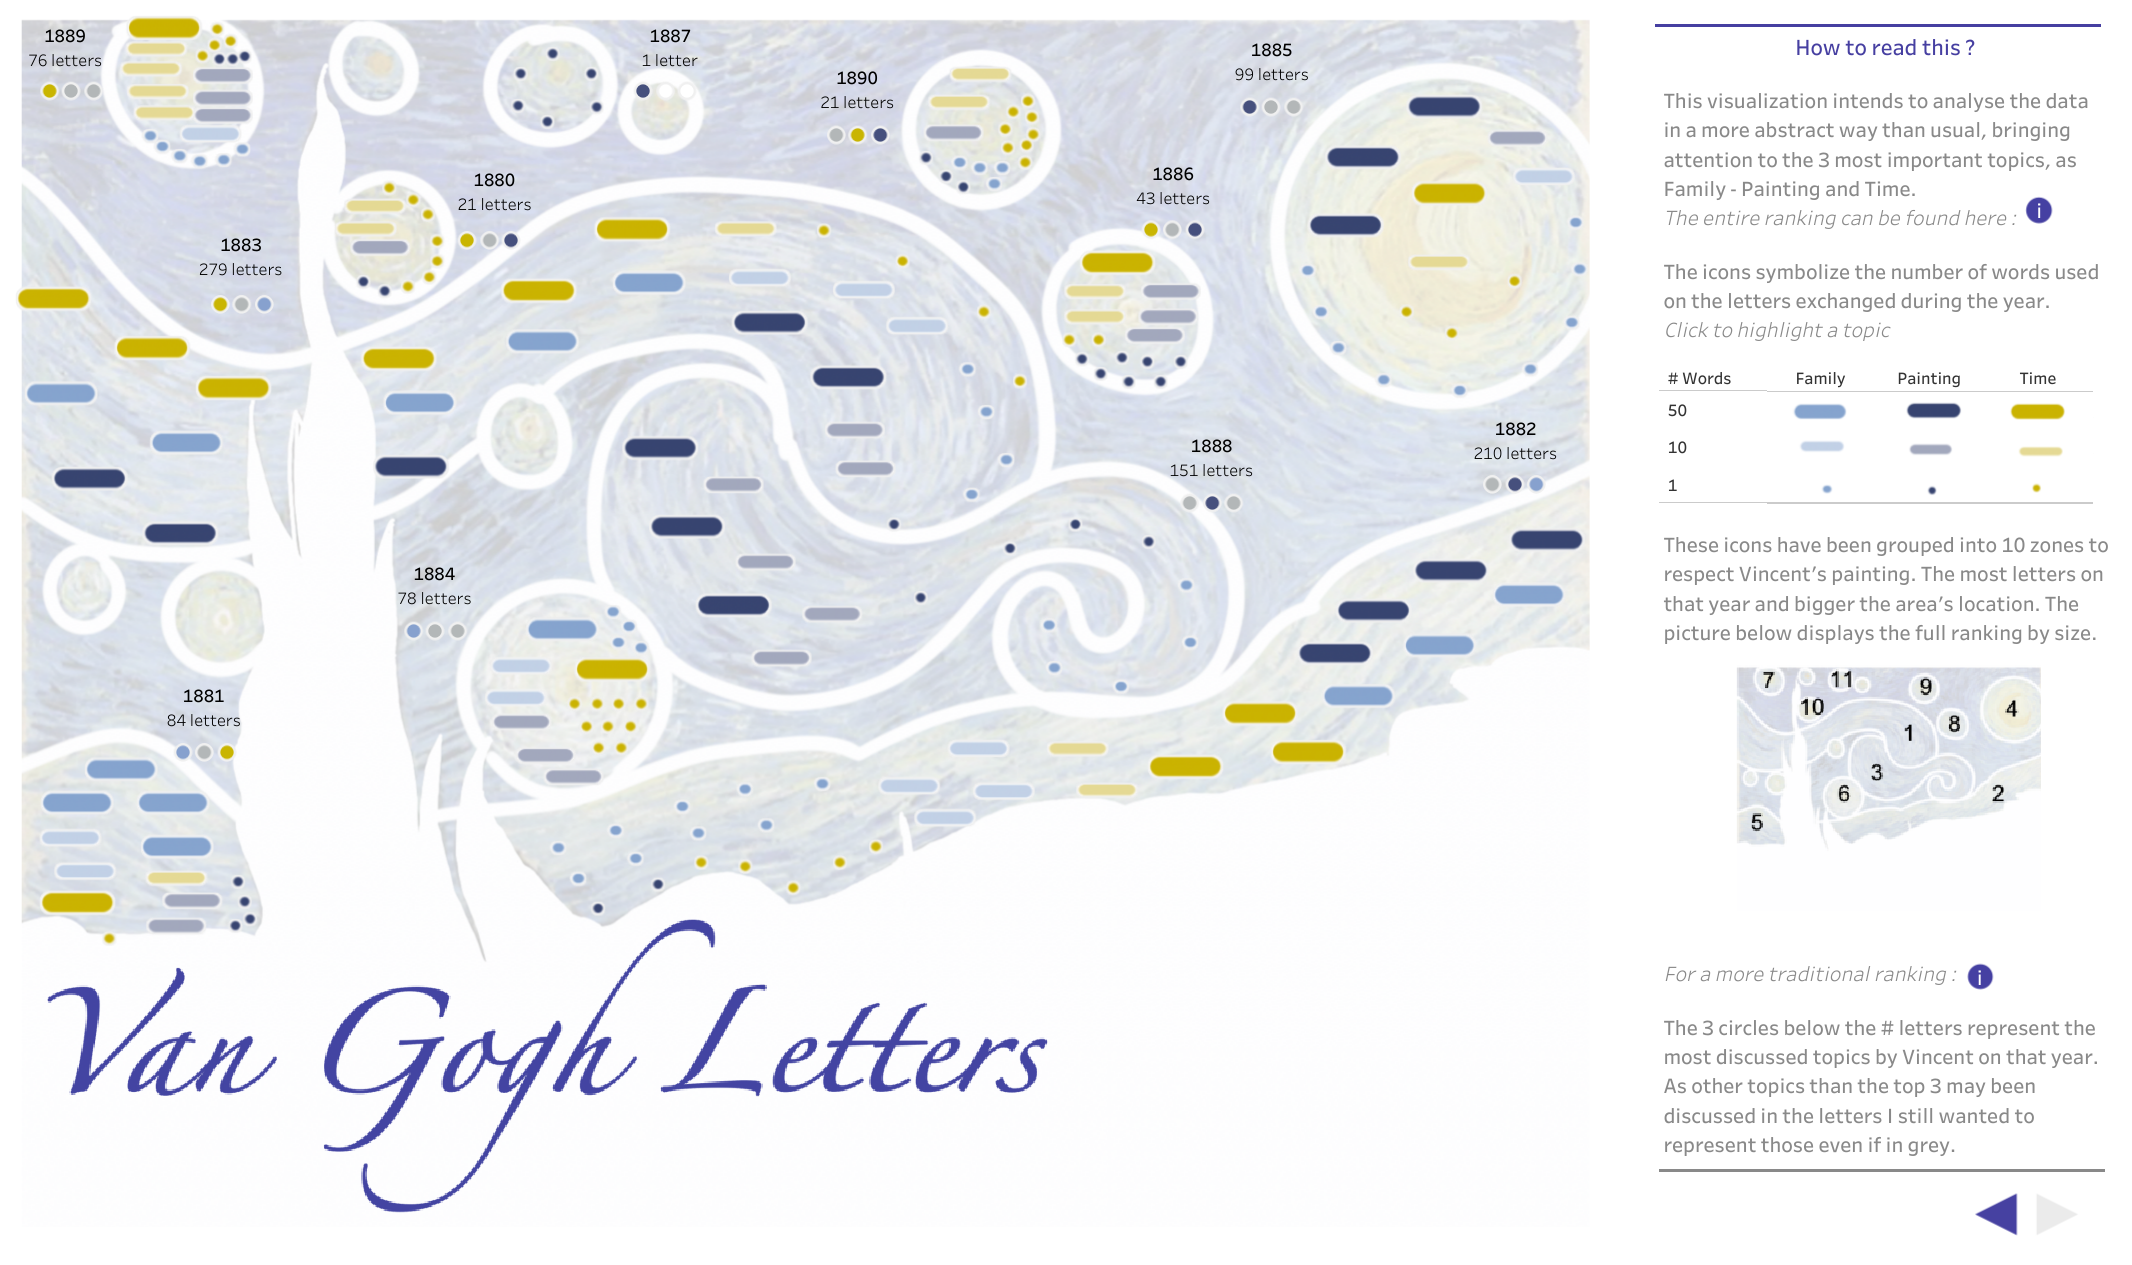
Annabelle Rincon: Van Gogh Letters
See the latest Viz of the Day, trending vizzes, featured authors, and more on Tableau Public.
Check out some inspirational vizzes created by the community:
- Pradeep Kumar G: Sample Superstore | Tableau Pulse Edition
- P A T H | We Are Data People: Top 200 Spotify 2024
- Matthias Giger: Resolved Issues Tableau Desktop, Prep and Server
- Stanley Gai: Afghanistan's Reverse Progress in Female Education
- Annabelle Rincon: Van Gogh Letters
- Sherzodbek Ibragimov: How Many Glasses of Water You Should Drink a Day
- Deepak Holla: Continuous Date Value Vs Discrete Date Part
- Uduak Afang: Hotel Management - Bookings Dashboard
- Caroline Swiger: #B2VB 2024: Build a Unit Chart
- Naresh Suglani: London in Numbers
- Anastasiia Kuznetsova: Lighthouses of the World
- Jennifer Dawes: Data Calculations
- Keren Aharon: Data Visualisation Catalogue Part2
- Abbie Taylor: Rainy Days
- YusukeNakanishi: Parks for Kids!
- Priyanka Dobhal: MakeoverMonday2024 Week 28 - The Surge of Large Learning Models (LLMs) in the A.I. Era
Community Projects
Back 2 Viz Basics
A bi-weekly project helping those who are newer in the community and just starting out with Tableau. Not limited just to newbies!
Web: Back 2 Viz Basics
X: #B2VB
Week 14: Build a Unit Chart
Workout Wednesday
Build your skills with a weekly challenge to re-create an interactive data visualization.
Web: Workout Wednesday
X: #WOW2022
Week 29: Formatting & Intermediate Tableau Charts
Preppin' Data
A weekly challenge to help you learn to prepare data and use Tableau Prep.
Web: Preppin’ Data
X: #PreppinData
Week 29: Formula 1 Qualifying Special
Makeover Monday
Create business dashboards using provided data sets for various industries and departments.
Web: Makeover Monday
X: #MakeoverMonday
Week 29: Open Era Wimbledon Singles Championships
DataFam Con
A monthly challenge covering pop culture and fandoms.
Web: DataFam Con
X: #DataFamCon
March 2024 Challenge: Sports Movies Edition
EduVizzers
A monthly project connecting real education data with real people.
Web: Eduvizzers
July 2024: Texas Education Agency
Viz for Social Good
Volunteer to design data visualizations that help nonprofits harness the power of data for social change.
Web: Viz for Social Good
X: #VizforSocialGood
July 5 - 26: Future Fridays
Games Night Viz
A monthly project focusing on using data from your favorite games.
Web: Games Nights Viz
X: #GamesNightViz
Season 2: Cooking up the Spice of Data
Iron Quest
Practice data sourcing, preparation, and visualization skills in a themed monthly challenge.
Web: Iron Quest
X: #IronQuest
Iron Quest – Maps II
Storytelling with Data
Practice data visualization and storytelling skills by participating in monthly challenges and exercises.
Web: Storytelling with Data
X: #SWDChallenge
July 2024: graphing for—or with—kids
Project Health Viz
Uncover new stories by visualizing healthcare data sets provided each month.
Web: Project Health Viz
X: #ProjectHealthViz
Diversity in Data
An initiative centered around diversity, equity & awareness by visualizing provided datasets each month.
Web: Diversity in Data
X: #DiversityinData
Sports Viz Sunday
Create and share data visualizations using rich, sports-themed data sets in a monthly challenge.
Web: Sports Viz Sunday
X: #SportsVizSunday
Real World Fake Data
Create business dashboards using provided data sets for various industries and departments.
Web: Real World Fake Data
X: #RWFD
2024 - Admin Insights
Data Plus Music
A monthly project visualizing the data behind the music we love!
Web: Data Plus Music
X: #DataPlusMusic
Related Stories

DataFam Roundup: February 24-28, 2025

DataFam Roundup: February 17-21, 2025

DataFam Roundup: February 10-14, 2025
Subscribe to our blog
Get the latest Tableau updates in your inbox.