Banking Giant BNP Paribas Builds Localized Experience with Tableau
From local branch performances to the sites of ATM "hotspots," detailed regional information can be invaluable for major financial service providers. But how do global banking leaders even begin to make sense of data that's so strongly linked to specific locales?
At BNP Paribas—the French bank that was named number one in the Eurozone—the answer is Tableau. In this interview, Pierre Thebault, marketing geoanalyst at the banking giant, describes how BNP Paribas uses Tableau to create a more localized service experience and more targeted marketing strategies.
“Before Tableau," Thebault explains, "we relied on spreadsheets and an Access database. It took hours, weeks—sometimes months—to reach the right data and get the answers we needed."

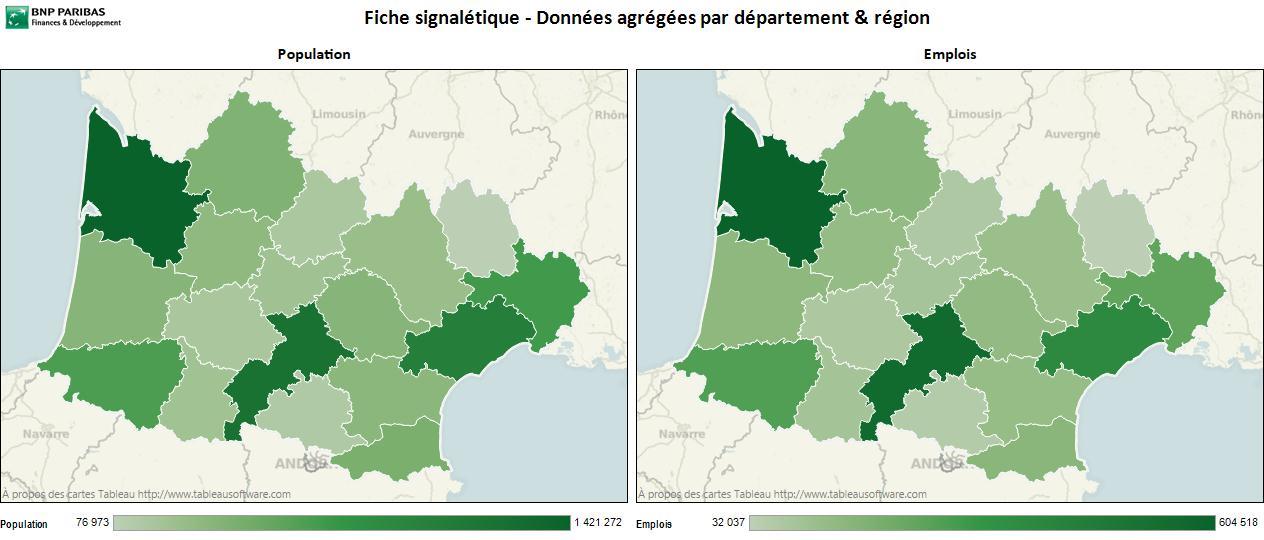
But now, BNP Paribas—which operates some 2,000 banks with a regular staff of 200,000—can create visualizations of its regional data within minutes. And when local trends can just pop up from a map, it's easier—and faster—to make informed business decisions.
Just some of the initiatives that the bank has undertaken since then are:
- Targeting customer-convenient locations for new ATMs
- Pinpointing likely prospects based on location and service needs, such as mortgage ownership
- Assessing local branches on a number of performance indicators, including customer adoption of internet banking
In Thebault's own words, “Tableau is the quickest route from the data to the decisions." Learn how BNP Paribas is using Tableau to map its future in the full interview. (Or watch a French-language version here.)
Subscribe to our blog
Get the latest Tableau updates in your inbox.


