AWS Cloud Cost and Usage Data in Tableau


Tableau, the world's leading analytics platform, offers a comprehensive set of capabilities and connectivity options for analysts to prepare, discover, and share insights across the enterprise with ease and efficiency. Tableau's Hyper technology allows for fast access to common file formats in Amazon Simple Storage Service (Amazon S3) buckets. The following is an example of performing analytics on your AWS costs and usage while taking advantage of Amazon S3's convenience and Tableau's fast access to S3 files.
AWS Cost and Usage Reports
The AWS Cost and Usage Reports (AWS CUR) contain the most comprehensive set of cost and usage data available. You can use AWS CUR to publish your AWS billing reports to an Amazon S3 bucket. You can receive reports that break down your costs by the hour, day, or month, by product or product resource, or by tags that you define. AWS updates the report in your bucket once a day. The report is saved either in a comma-separated value (CSV) format or parquet format.
Options to analyze AWS CUR data
AWS provides out of the box integration with Amazon Athena for analyzing the AWS CUR data. Here are a couple of options to analyze the AWS CUR data in Tableau:
- Use Amazon Athena Connector by Tableau to view and analyze the AWS CUR data via Athena.
- Use Amazon S3 Connector by Tableau to view and analyze the AWS CUR data by accessing it directly from Amazon S3.

There are multiple ways to look at your AWS CUR data. For example, you can find a Tableau Accelerator in Tableau Exchange to analyze the AWS CUR data via Athena. Here are some of the key metrics you can track with the accelerator:
- Spend by Month
- Average Monthly Spend
- Cost and usage by period (week, month, quarter, year, all-time)?
- Relation between cost and usage? (cost optimization)
- Spend per each AWS service
- Cost across all accounts
- Costs across AWS regions
- Costs by EC2 instance and operating system
Configure, access, and analyze AWS CUR Data via Amazon S3 Connector
There are three main steps to configure AWS CUR and analyze the data in Tableau with the S3 Connector:
- Set up AWS CUR.
- Set up and configure the Amazon S3 Connector.
- Dive deep into your AWS cost and usage data.
Step 1: Set up AWS CUR
The Cost and Usage Report documentation is the official source for instructions to set up AWS CUR. For your convenience, we have included those instructions with screenshots for some of the steps.
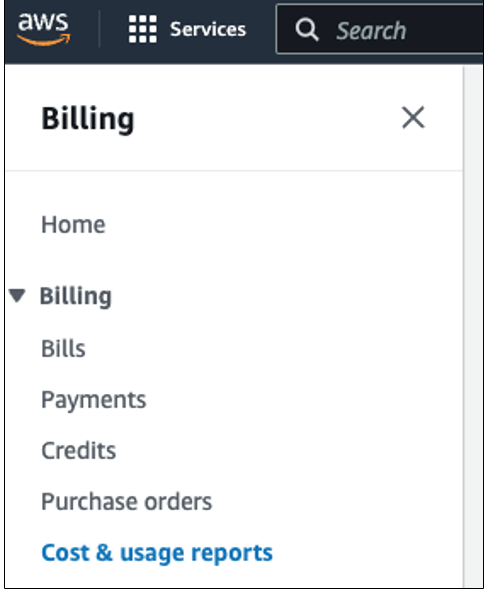
- Navigate to the Billing page in the AWS Console.
- Click on Cost & usage reports.
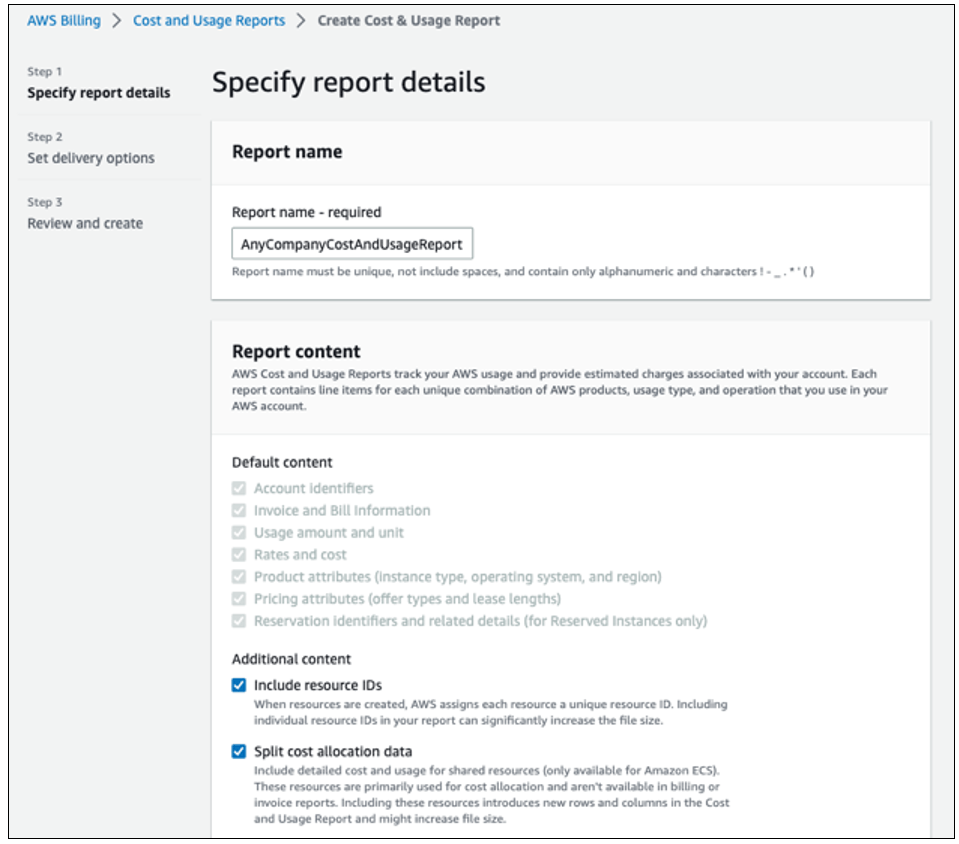
3. Create a report by providing the report name and select options based on your analytics requirements. Click Next to configure the S3 Bucket.

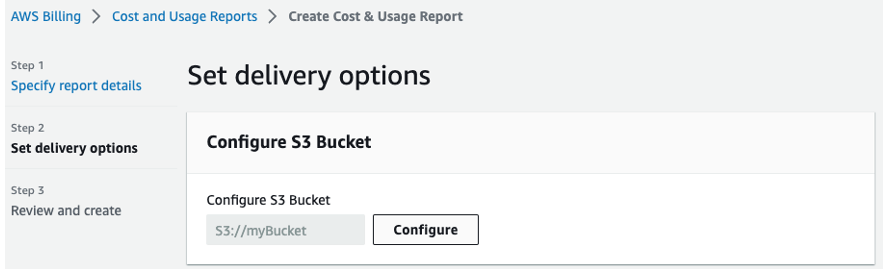
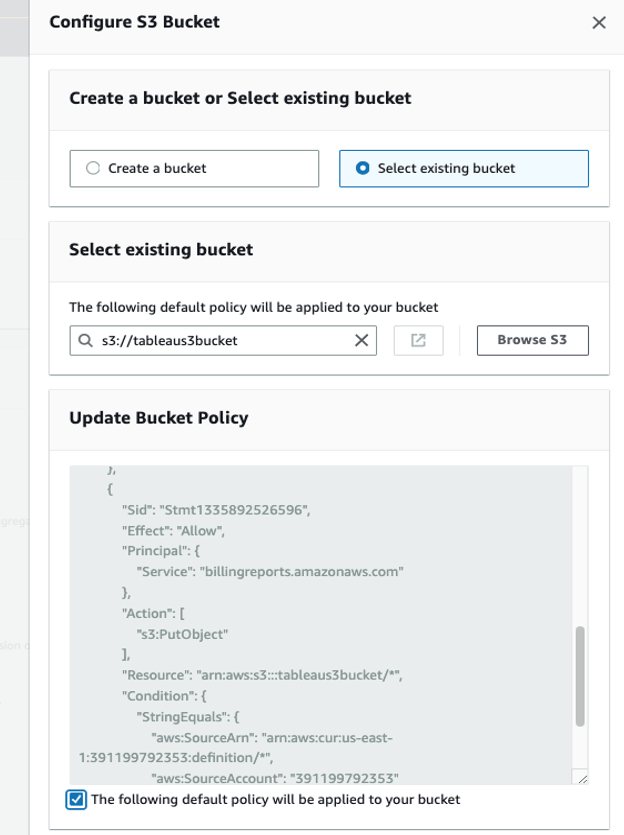
4. Configure the S3 bucket–either select an existing bucket or create a new one as shown below.
5. Choose the report delivery option as shown below. Here are some considerations:
- Report data integration is not required since the Tableau Amazon S3 Connector is used.
- Set compression type to parquet for efficient storage.
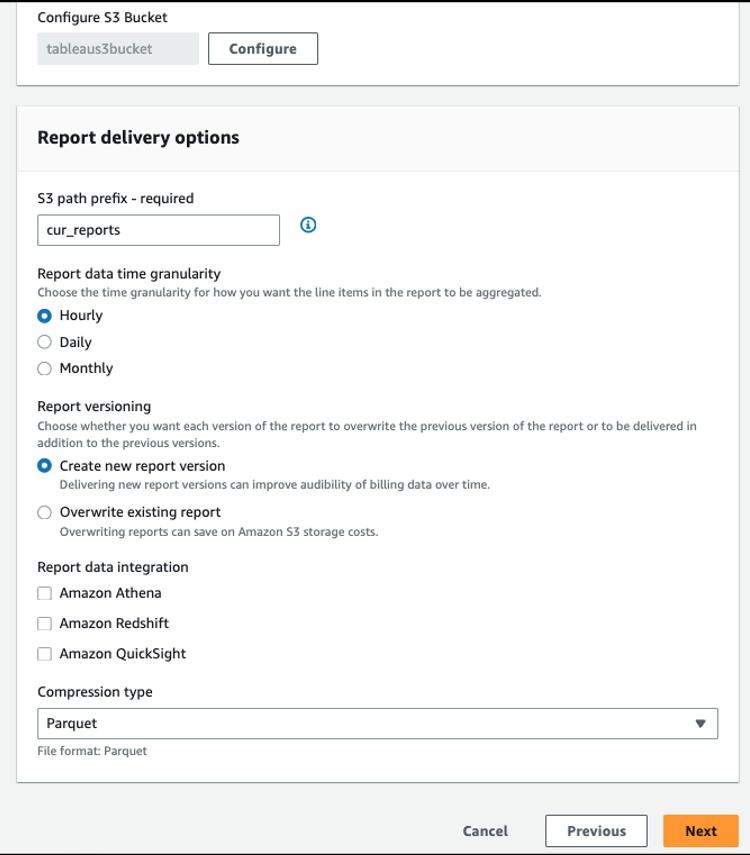
6. Click Next, review your configuration, and create the report.
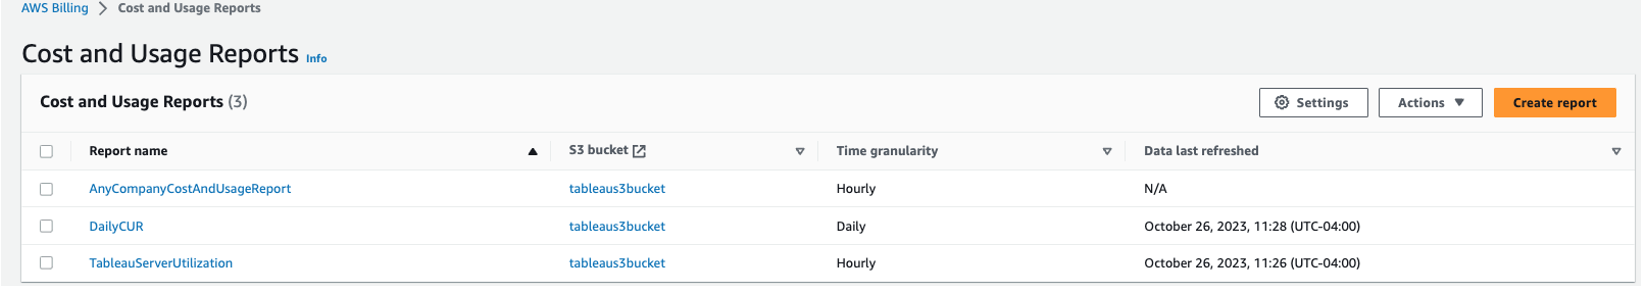
7. You can view the status of the report in the AWS Billing → Cost and Usage Reports console. It takes a day for the report to be generated.
For additional information refer to the Cost and Usage Report documentation.
Step 2: Set up and configure Amazon S3 Connector
- Follow the instructions to set up the Amazon S3 Connector.
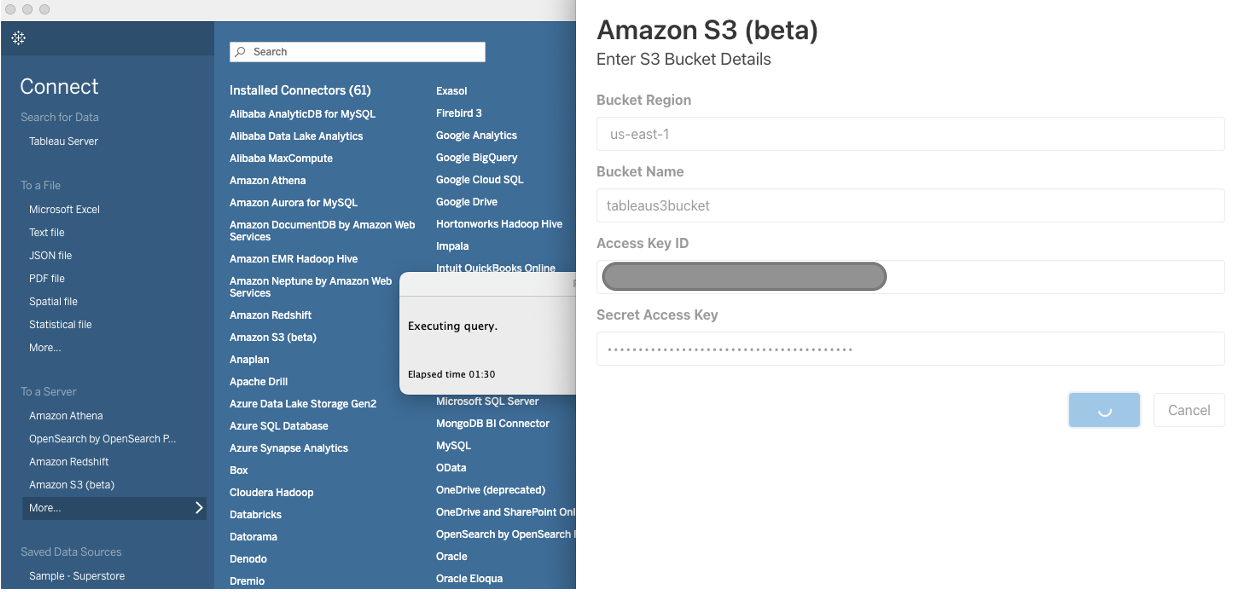
- Once the connector is set up, launch Tableau Desktop, and select Amazon S3.
- Provide the S3 bucket region, bucket name, access key ID, and secret access key as shown below.
4. Select the bucket provided for the AWS CUR data and click Connect.
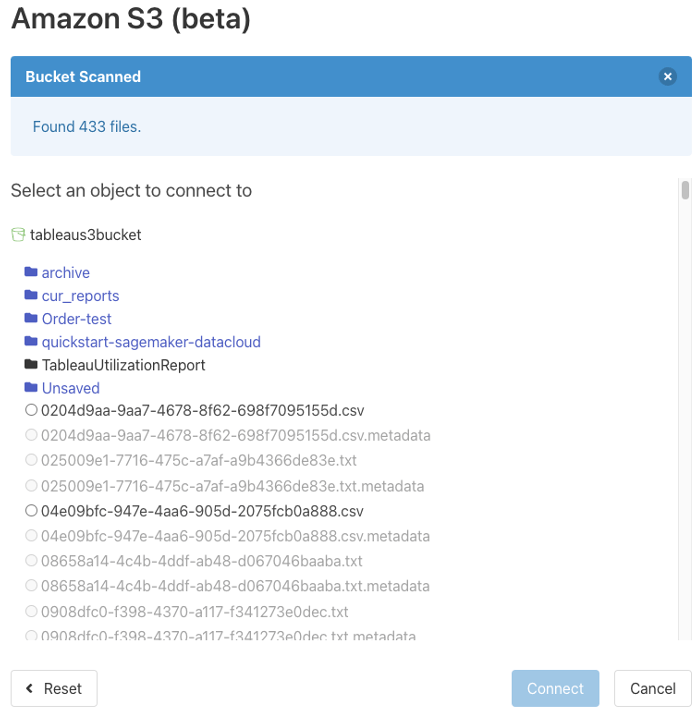
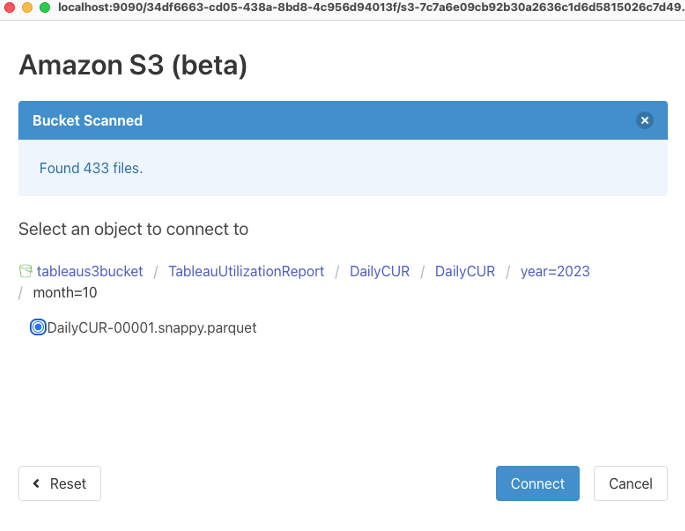
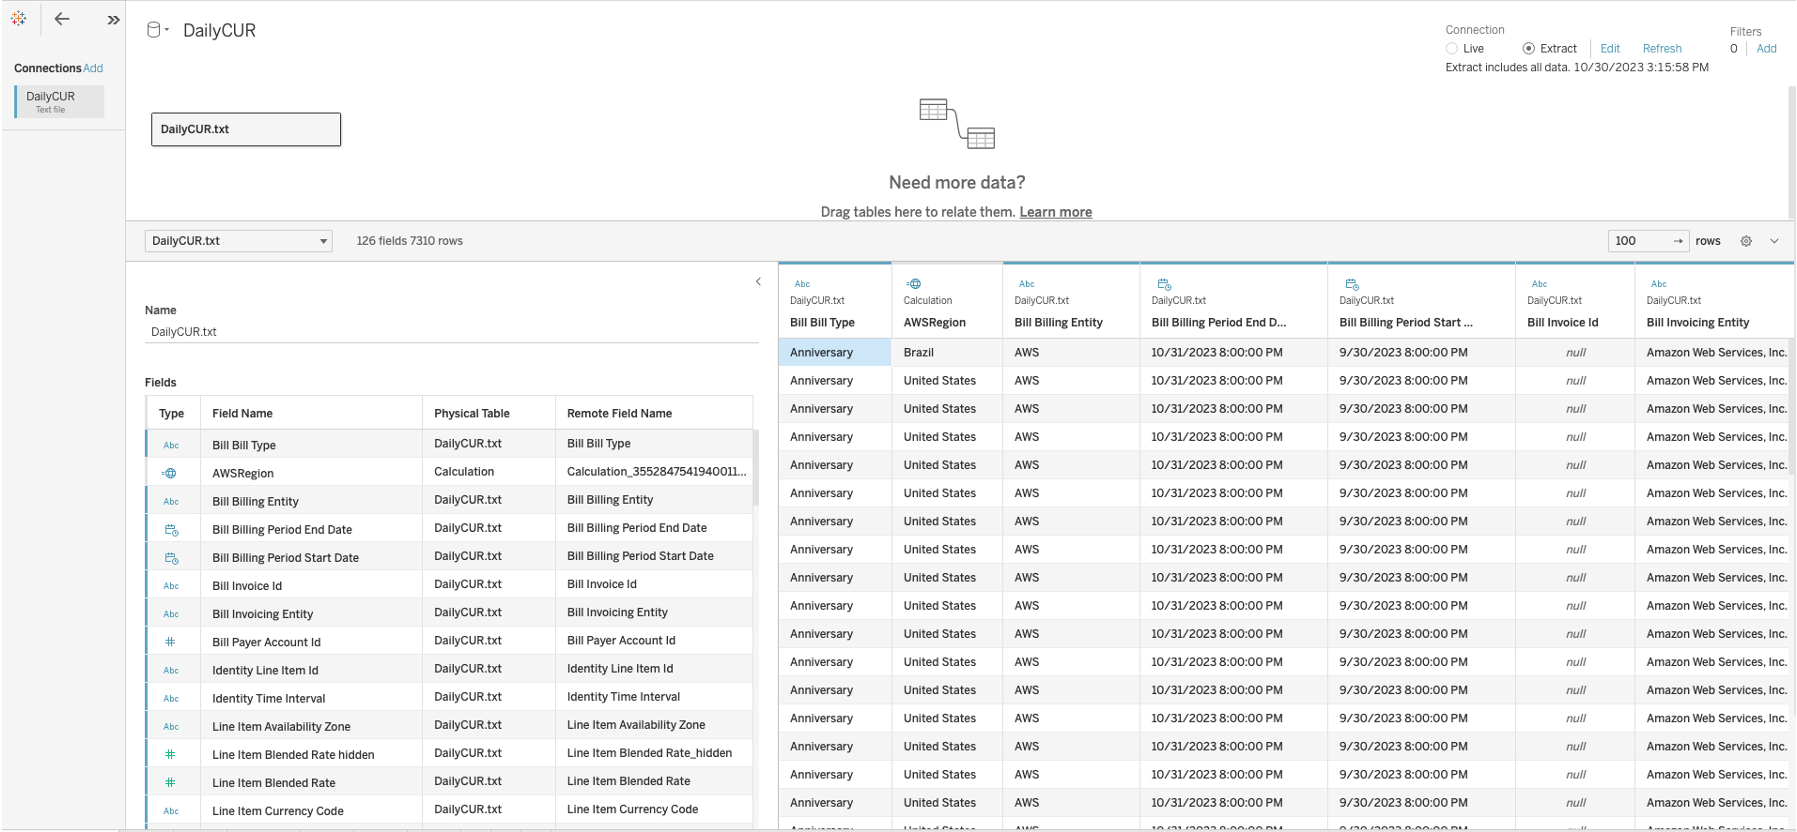
5. Once the S3 Data Source is configured, you can preview the data, explore, and start analyzing it. Tableau’s Hyper technology provides fast query performance and in-memory joins.
Step 3: Dive deep into your AWS cost and usage data
AWS CUR contain details about your usage. Review the data dictionary to analyze and generate insights for better understanding of your AWS cost and usage. Here are some examples:
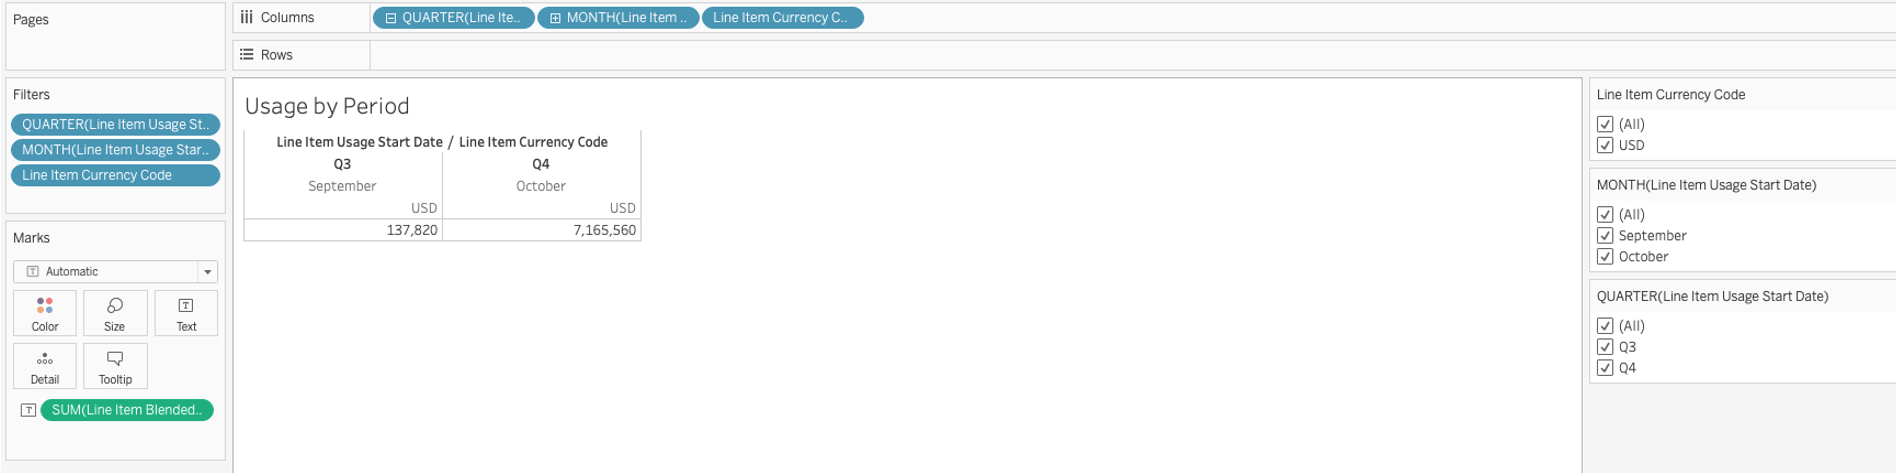
1. Aggregate Cost per Quarter
Aggregate the Line Item Blended Rate per quarter to understand the average cost incurred for each SKU across an organization.
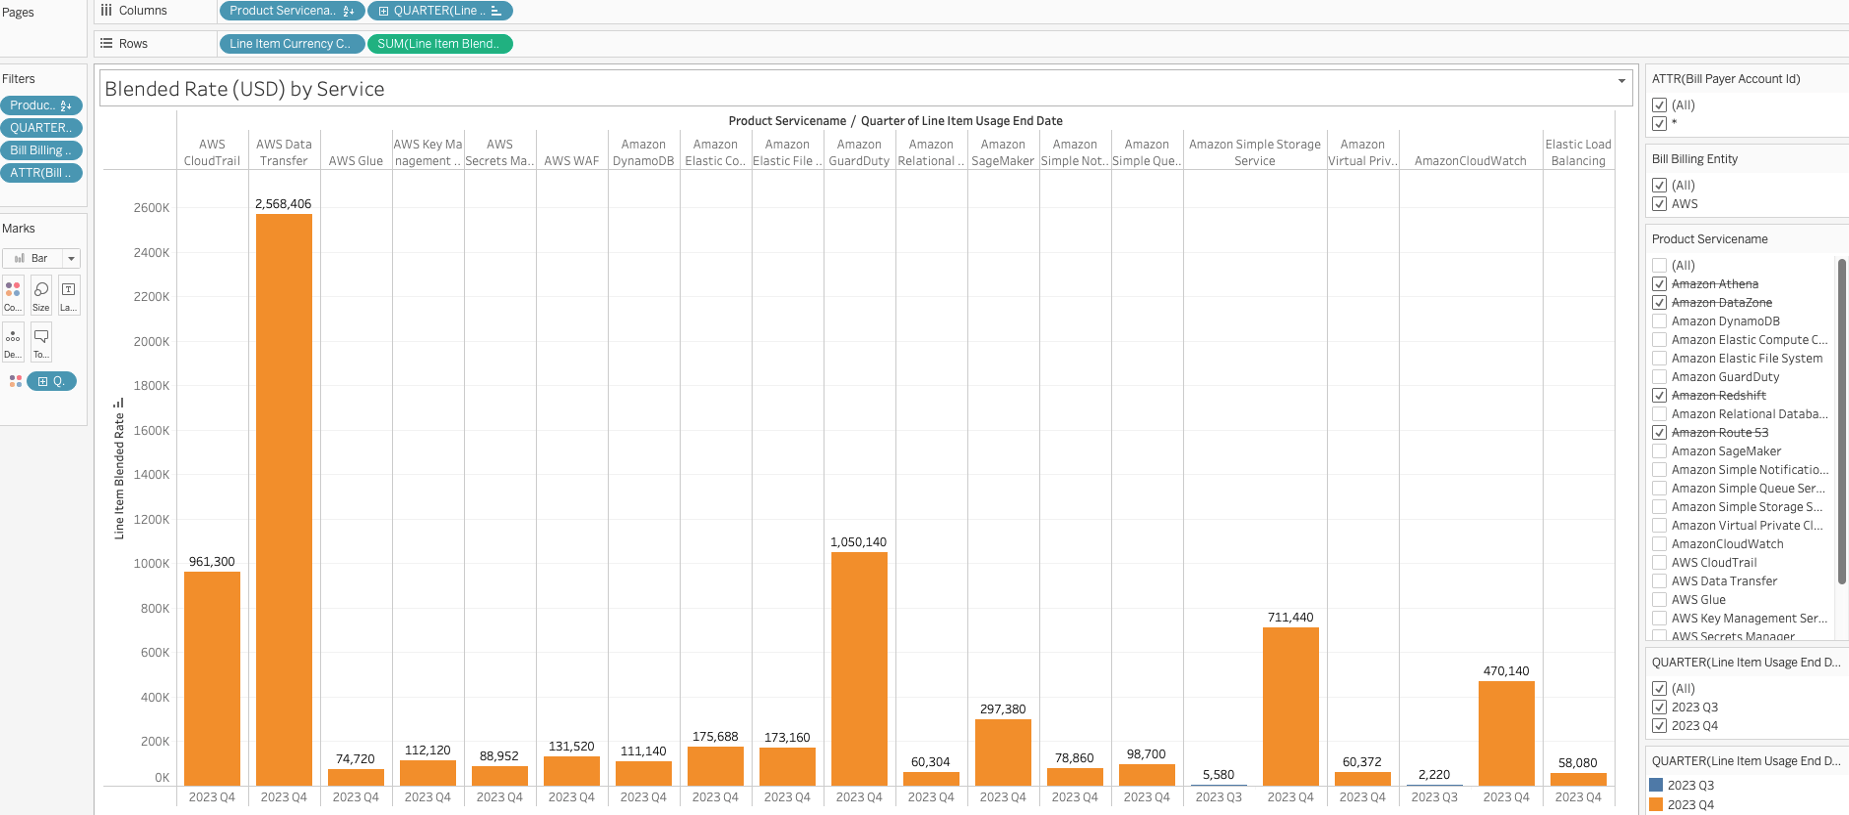
2. Blended Rate per Service per quarter
Drill down to plot the blended rate per quarter and per service to understand the service level spend.
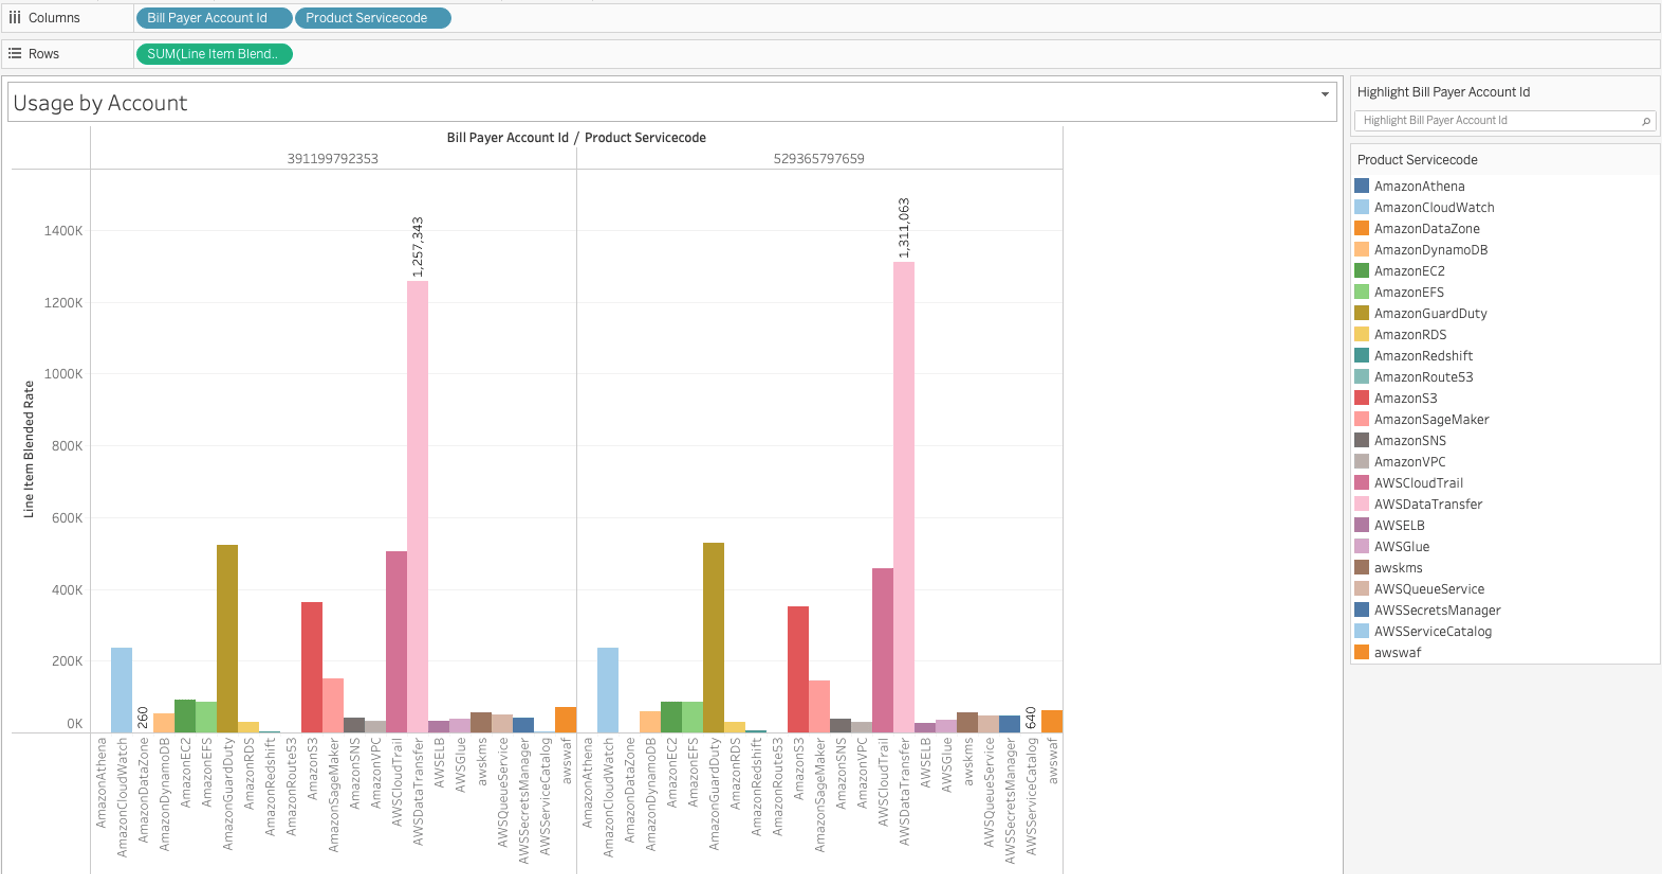
3. Usage per billing account
Track the service level usage for each billing account.
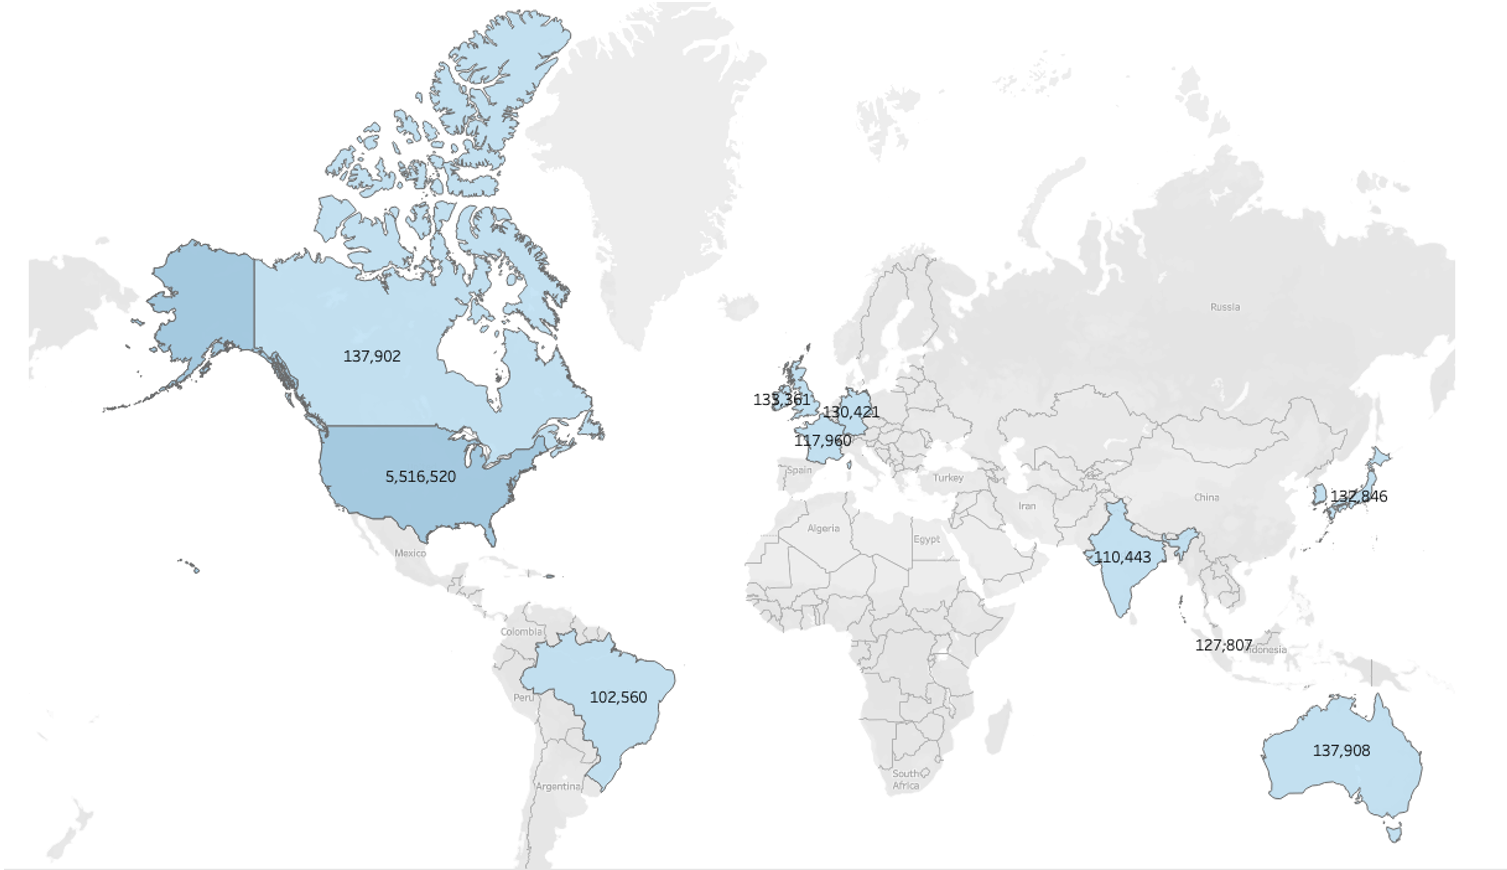
4. Service spend analysis at geographic level
Track the service usage at region level. To create this visualization, first you need to map the AWS Product Region to Country. A calculated field can be used to map the region as illustrated below.
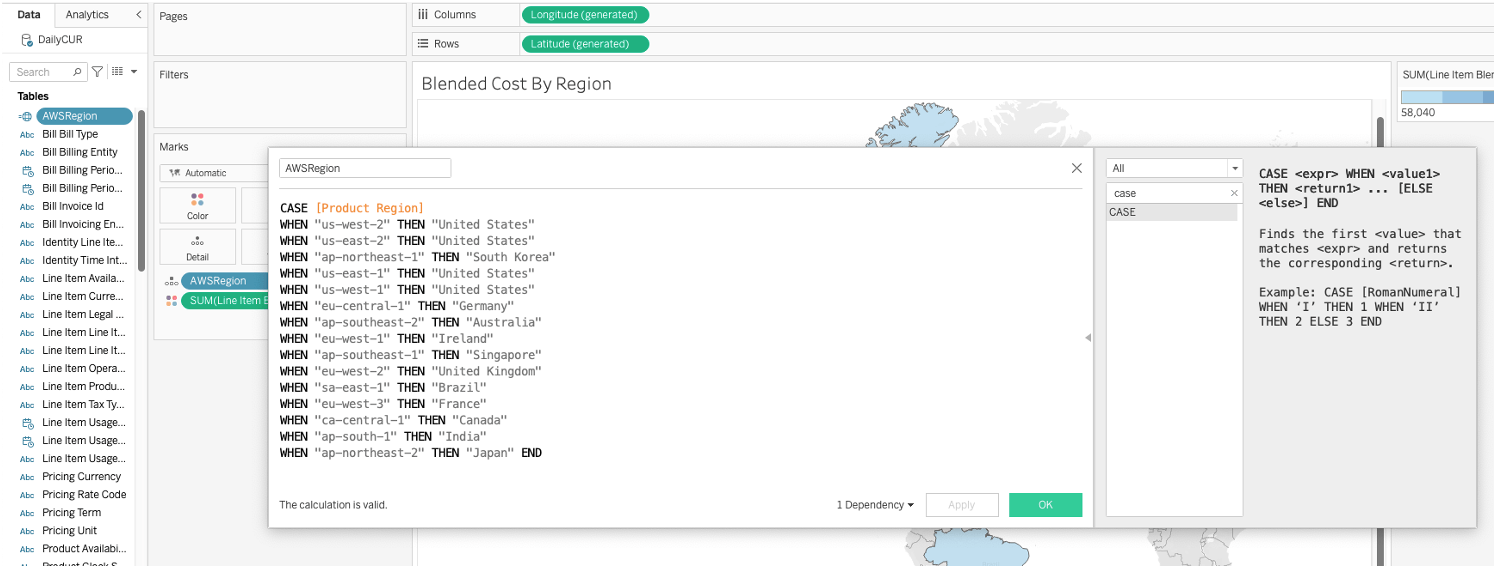
Mapping Logic :
CASE [Product Region]
WHEN "us-west-2" THEN "United States"
WHEN "us-east-2" THEN "United States"
WHEN "ap-northeast-1" THEN "South Korea"
WHEN "us-east-1" THEN "United States"
WHEN "us-west-1" THEN "United States"
WHEN "eu-central-1" THEN "Germany"
WHEN "ap-southeast-2" THEN "Australia"
WHEN "eu-west-1" THEN "Ireland"
WHEN "ap-southeast-1" THEN "Singapore"
WHEN "eu-west-2" THEN "United Kingdom"
WHEN "sa-east-1" THEN "Brazil"
WHEN "eu-west-3" THEN "France"
WHEN "ca-central-1" THEN "Canada"
WHEN "ap-south-1" THEN "India"
WHEN "ap-northeast-2" THEN "Japan" END
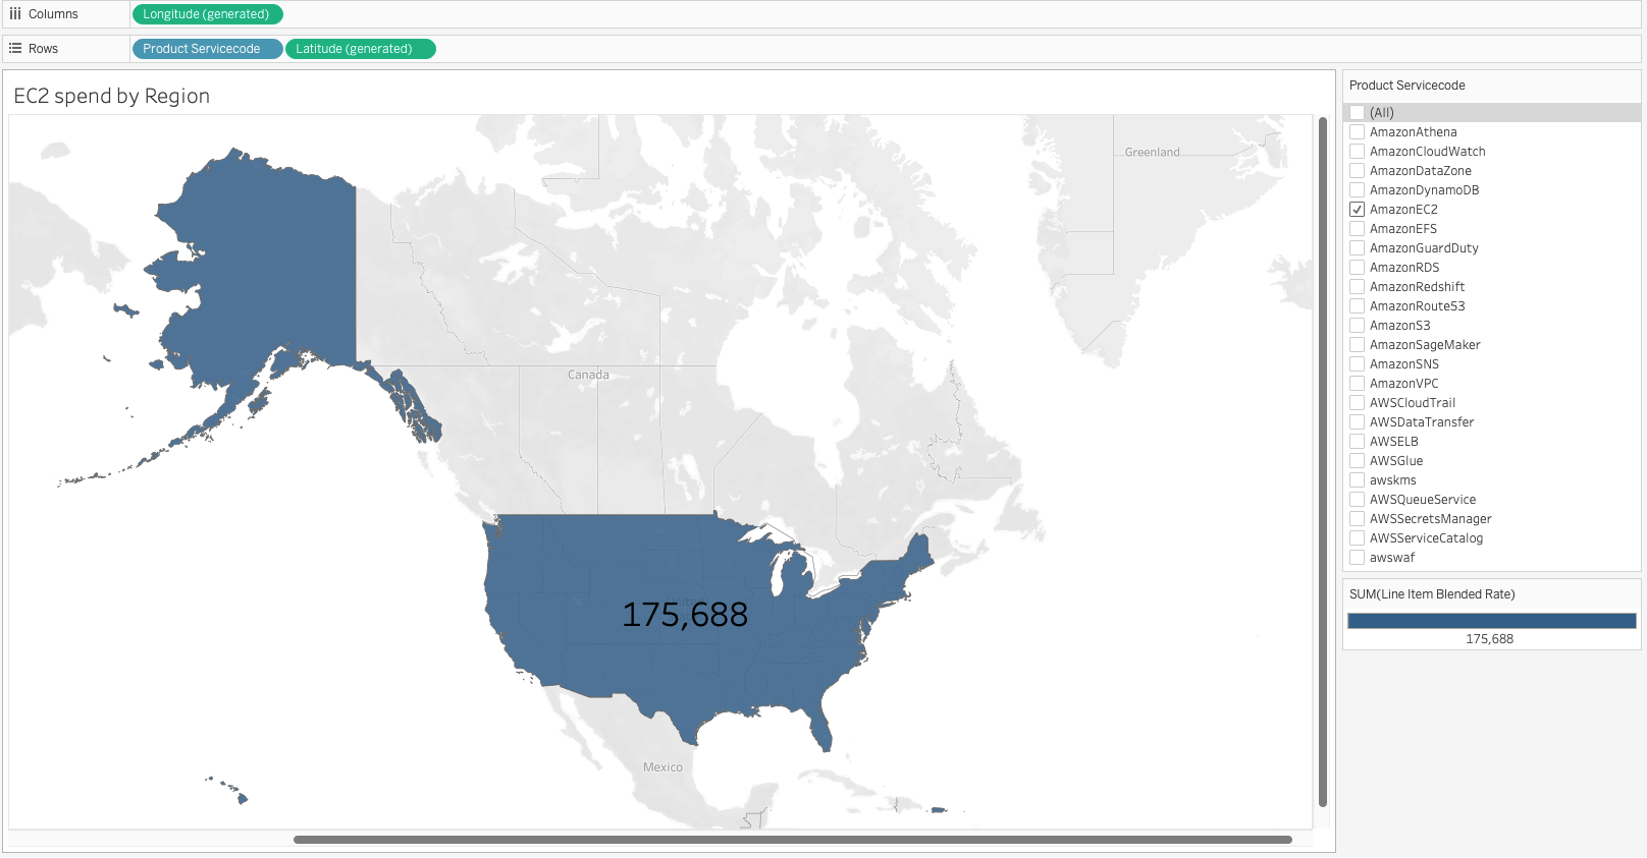
5. Regional service specific spend
Create a filter on the Product Servicecode field to track specific AWS service spend by region.
Editor’s note: Product leader Madeleine Corneli authored the original blog post on monitoring AWS Cloud Cost and Usage Data in Tableau in March 2019. Read more of Madeline’s blog posts.
Subscribe to our blog
Get the latest Tableau updates in your inbox.