Addressing the opioid epidemic with actionable visual analytics
The Western world is in the throes of an unprecedented opioid epidemic. In the US alone, more than 2 million Americans are either addicted or abusing prescription pain pills and similar drugs.
In the US in 2016-17, there were more than 63,600 overdose deaths, including 42,249 that involved an opioid (66.4%)—an average of 115 opioid overdose deaths per day. In 2016, the age-adjusted rate of drug overdose deaths in the US was more than three times what it was in 1999.
Opioid addiction, explained
The word “opioid” is derived from “opium”, and opioid drugs affect the human body similarly to opium. Opioids include both legal painkillers like morphine, hydrocodone and oxycodone—usually prescribed by physicians for acute or chronic pain—as well as illegally produced drugs sold on the street, like heroin and illicitly-manufactured fentanyl. Prescription and illegal opioids are abused extensively because they are so addictive. Opioid medications and drugs bind to the pain and emotion controlling areas of the brain, triggering levels of serotonin and dopamine, culminating in a feeling of utter euphoria. As the brain becomes conditioned to the highs, it takes increased amounts of the drug to generate the same levels of pain relief and euphoria, often leading to dependence and addiction.
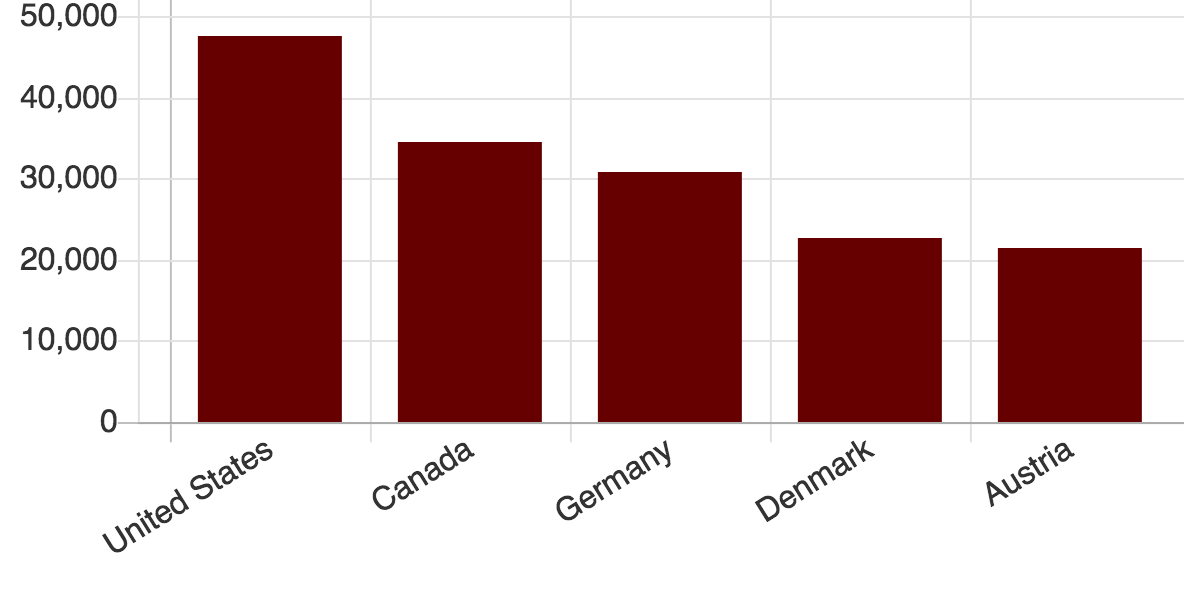
Figure 1. The top five countries with opioid abuse 2013-15. This figure illustrates the consumption of opioids in doses per million people per day. Source: International Narcotics Control Board.
The number of opioid prescriptions dispensed by doctors in the US steadily increased from 112 million prescriptions in 1992 to a peak of 282 million in 2012, according to a recent article in the New York Times, and data from IMS Health. The number of prescriptions dispensed has since declined, falling to 236 million in 2016.
While the US has the largest opioid abuse epidemic among developed nations, Canada follows the US in terms of consumption of opioids in doses per million people per day.

Figure 2. The opioid epidemic in the US by the numbers. Source: US Department of Health and Human Services
Alberta Health Services: battling the crisis with visual analytics
Alberta Health Services (AHS) is Canada’s first and largest province-wide, fully-integrated health system, responsible for delivering health services to the over 4 million people living in Alberta, as well as to some residents of Saskatchewan, B.C. and the Northwest Territories.
AHS by the numbers:
- 106 acute care hospitals
- 5 stand-alone psychiatric facilities
- 8,448 acute care beds
- 25,653 continuing care beds/spaces and
- 243 community palliative and hospice beds
- 2,723 addiction and mental health beds plus
- Equity partnership in 41 primary care networks
- Programs and services at over 650 facilities province-wide
Given the significant opioid abuse epidemic across the province of Alberta, AHS embarked on an ambitious initiative to proactively detect and address the needs of the afflicted by leveraging their self-service visual analytics platform and solutions.
Figure 3 (below) illustrates the number of emergency department (ED) visits and Emergency Medical Services (EMS) responses to all opioid related incidents by location and helps AHS identify the extent of the epidemic and focus on the locations with the highest incidence of opioid abuse.
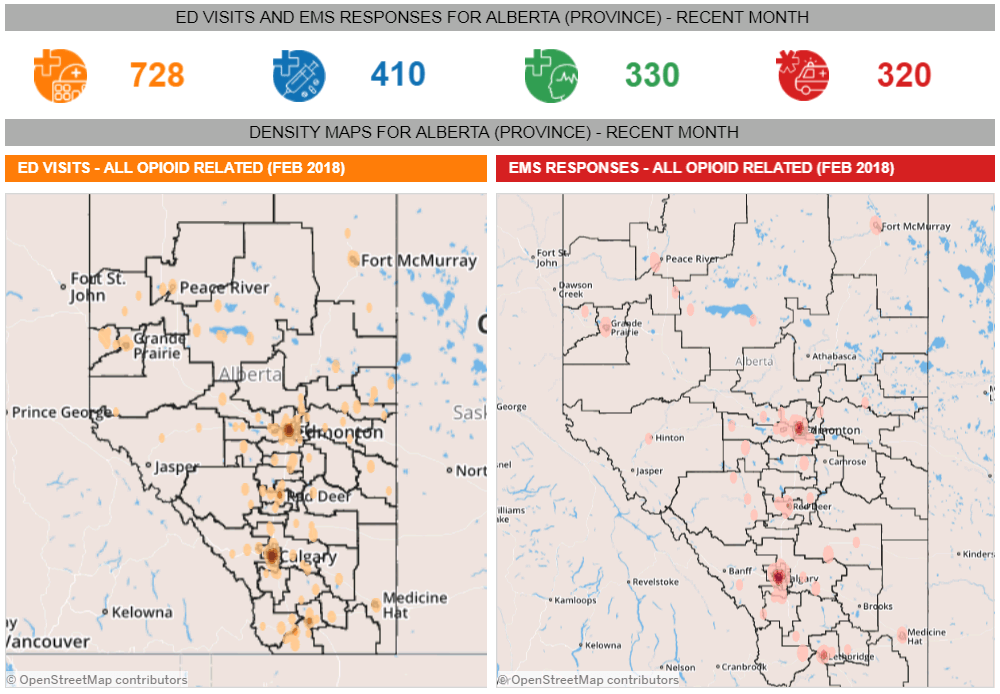
Figure 3. Visual analytics dashboard illustrating the number of emergency department (ED) visits and EMS responses to all opioid related incidents by location
This is also mapped to the associated ICD-10- CA codes (Figure 4 below) to understand the trends in opioid abuse traced to the underlying narcotic and hallucinogen and their relative contribution to the epidemic.
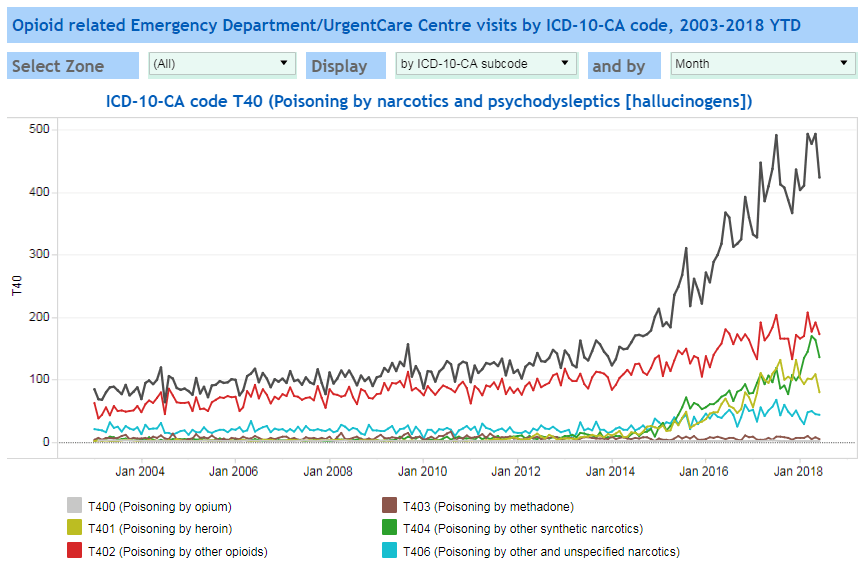
Figure 4. Opioid related Emergency Department/Urgent Care center visits mapped to ICD-10- CA codes showing trends in opioid usage by the specific narcotic or hallucinogens.
Treatment protocol at AHS includes distributing Naloxone, a medication designed to rapidly reverse opioid overdose. It can very quickly restore normal respiration to a person whose breathing has slowed or stopped as a result of overdosing with heroin or prescription opioid pain medications.
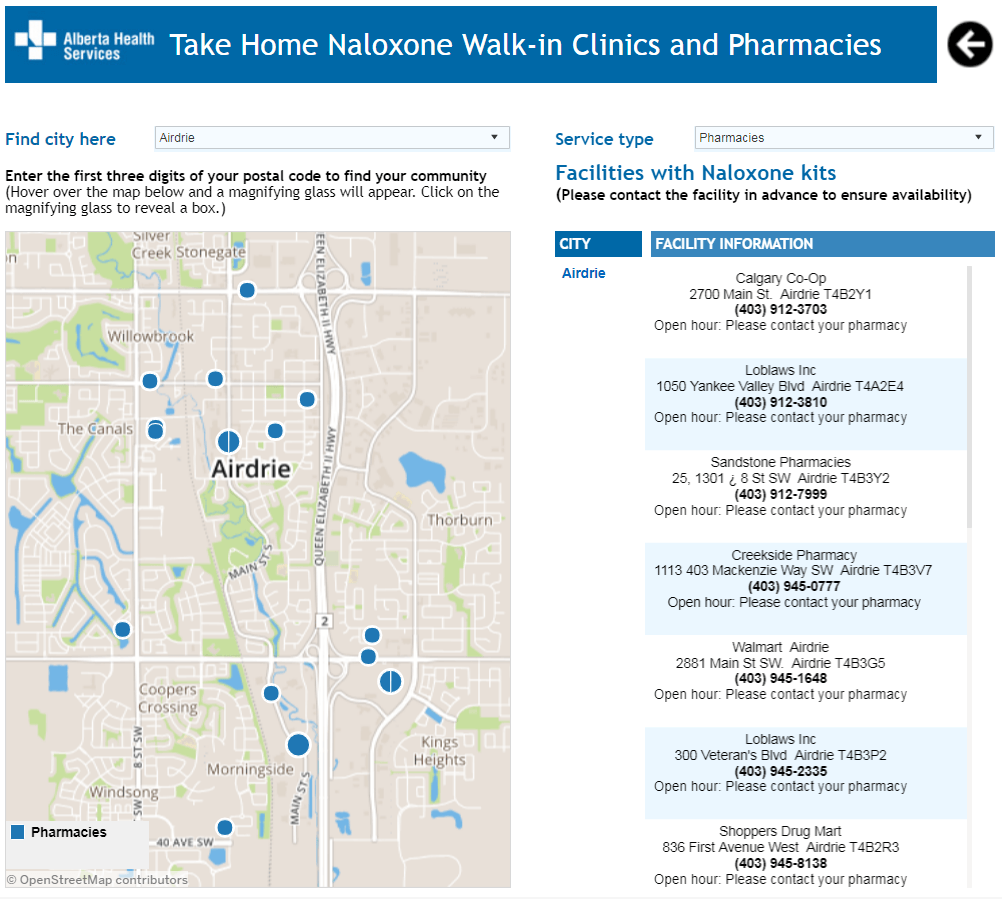
Figure 5. Listing and geo mapping pharmacies and walk-in clinics distributing Take Home Naloxone (THN) kits on visual analytics dashboards published on the AHS web-pages.
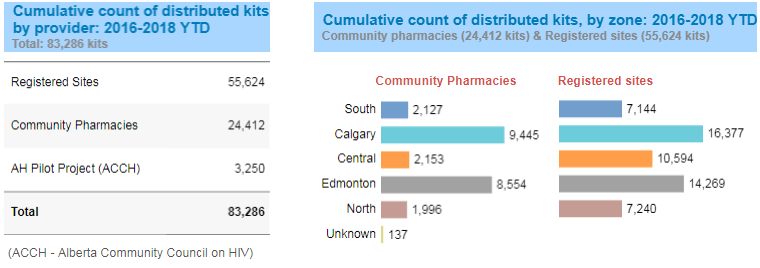
Figure 6. Ongoing program monitoring of the Take Home Naloxone (THN) kits distribution initiative.
Visual analytics solutions like these help AHS understand the trends and the drugs contributing to the opioid epidemic in Alberta—and significantly, visual analytics are used to identify the most vulnerable patient populations. In turn, this helps with forecasting, allocation, and locating nearby pharmacies and walk-in clinics for distribution of Take Home Naloxone (THN) kits. Identifying and geo mapping these pharmacies and walk-in clinics on visual analytics dashboards published on the AHS web pages (Figure 5) helps these patients, their relatives, and friends to quickly locate the nearest pharmacy or walk-in clinic to pick up the THN kits so a potential opioid overdose can be reversed as soon as possible.
Executive level dashboards such as the one shown in Figure 6 help executives and business leaders periodically monitor, measure, analyze and improve the program based on these actionable metrics and KPIs.
Promising results
While still early, the opioid monitoring and surveillance initiative at Alberta Health Services (AHS) enabled by actionable self-service visual analytics, targeting the most vulnerable and at risk, is promising. This is an operational model that can potentially be emulated in cities, states, and provinces across North America to address what is perhaps the most menacing epidemic of the 21st century.
Related Stories
Subscribe to our blog
Get the latest Tableau updates in your inbox.


