24 Can’t-Miss Tableau Features Released in 2024
As we look back on 2024, one thing is clear: AI and automation took center stage, transforming how we see, understand, and act on data. From the debut of Tableau Pulse to powerful integrations with AI, this year’s releases made insights more actionable than ever. But innovation didn’t stop at AI—across the board, Tableau introduced features designed to help organizations drive better business outcomes. Ready to explore the highlights? Let’s take a closer look at 24 standout Tableau features that shaped 2024—and discover how they can elevate your work.
23. New Connectors with Tableau
21. Accessibility Improvements
20. Display Data Model for Published Data Sources
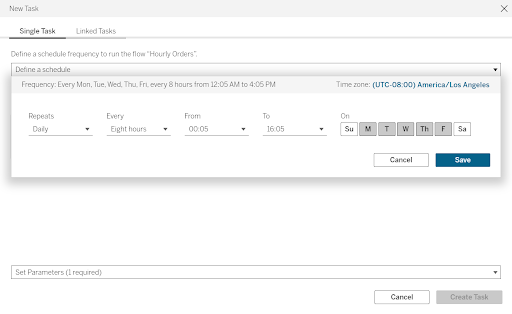
19. Tableau Prep Conductor Supports Custom Schedules
17. Exchange on Tableau Public
16. Incremental Extracts with Subrange Refresh
14. Migration SDK
12. Tableau Desktop Public Edition Local File Save
11. Autosave
9. Spell Check on Tableau Cloud and Server
7. Multi-fact Relationships and Multi-fact Relationship Infoscenting
6. Tableau App for Microsoft Teams
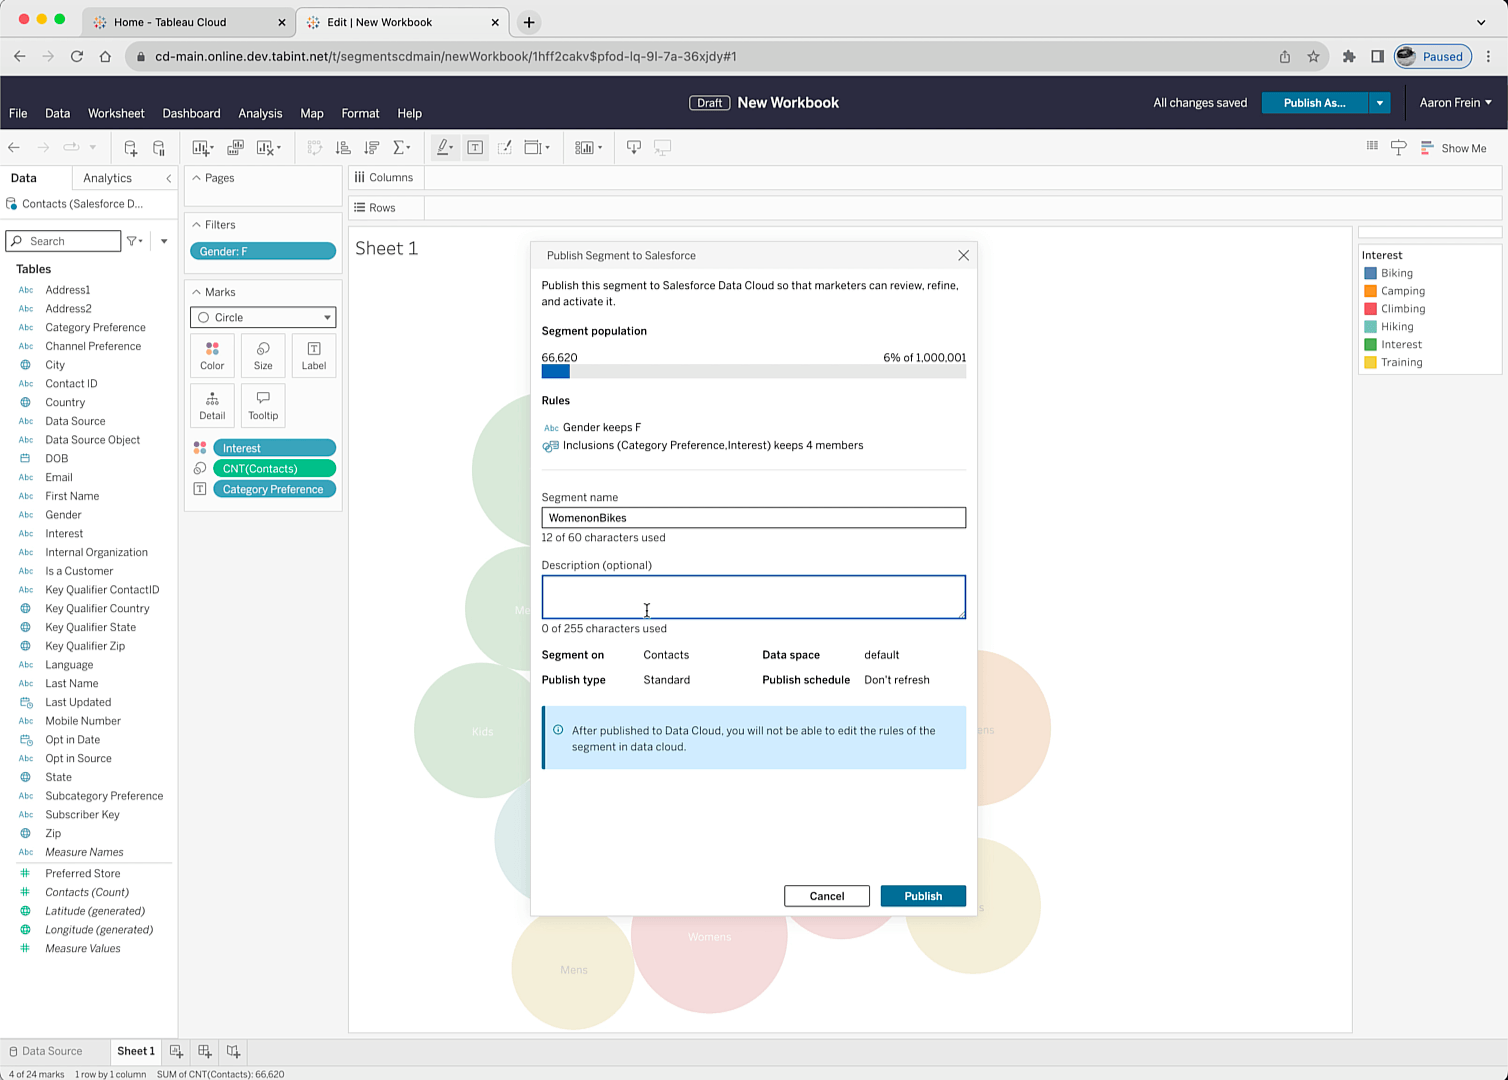
24. Tableau and Data Cloud
Released in 2024.1
Create segments in Data Cloud directly from your visual data exploration within Tableau. Visual Segment Creation to Salesforce Data Cloud provides you with a streamlined way to explore the data from your Data Model Objects (DMOs), identify candidate audience segments, and push those audience segments directly in Data Cloud from your Web Authoring session.
23. New Connectors with Tableau
Tableau added connectivity to support a streamlined connection to new data sources including the Tableau and Databricks Delta Sharing connector.
Tableau Delta Sharing:
- Provides a powerful solution for sharing data to external organizations, fostering collaboration with partners and customers
- Shares live data across platforms, eliminating the need for replication
- Improves data governance with centralized access management
- Empowering teams to access and analyze data from multiple sources helps create a more holistic view of their business
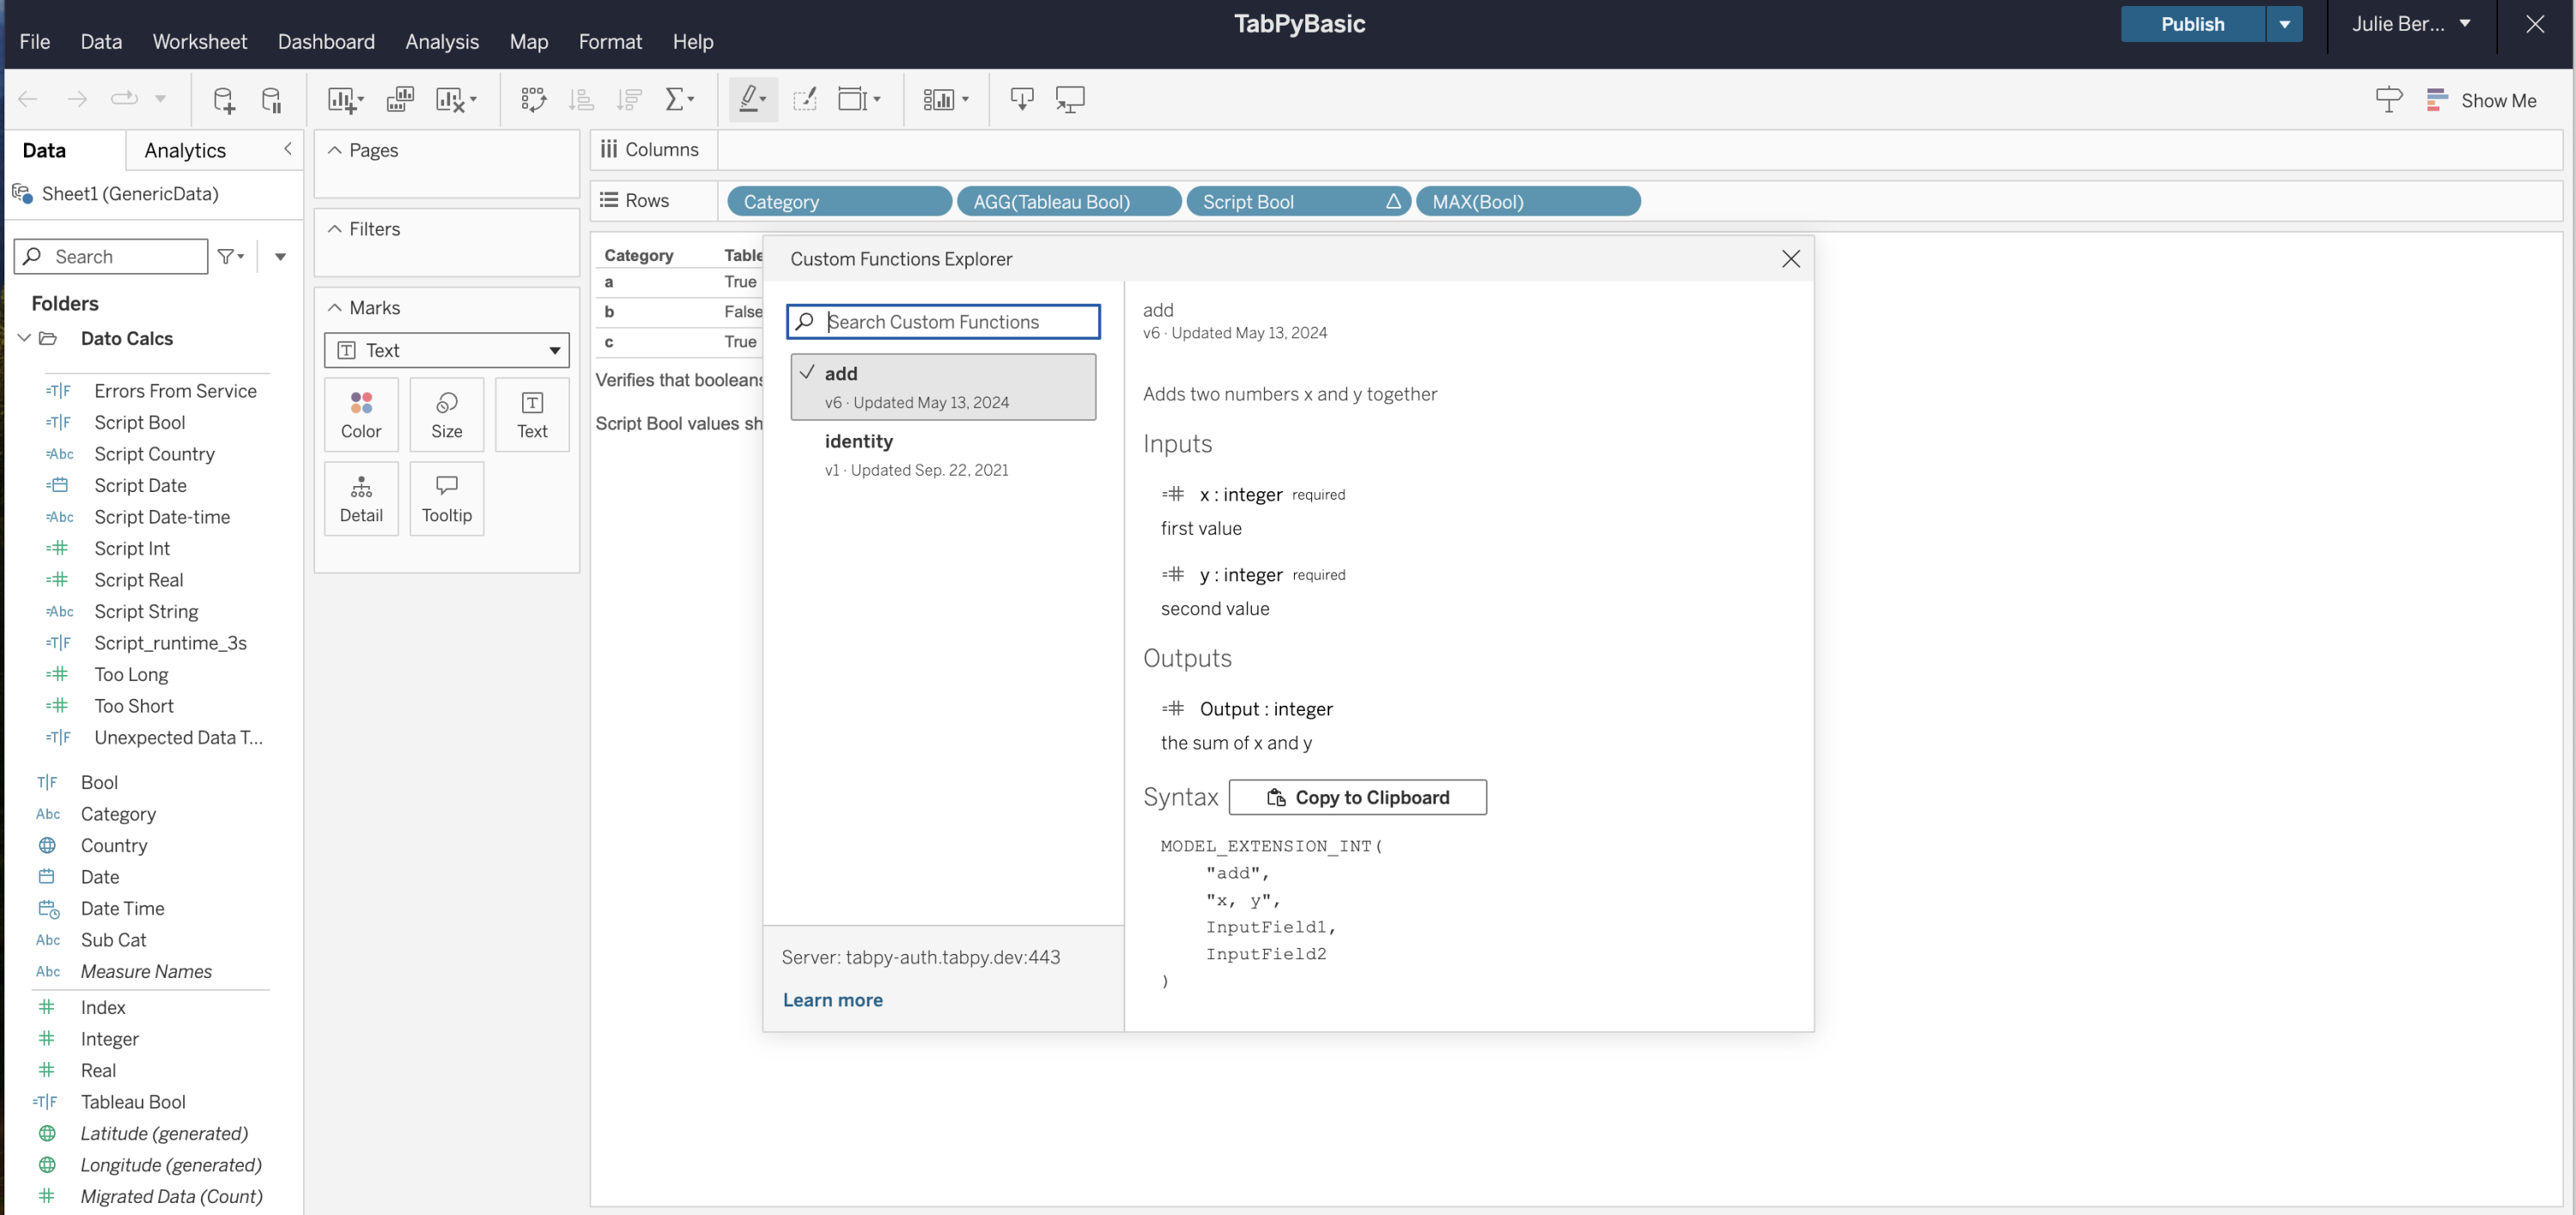
22. Custom Functions Explorer
Released in 2024.3
Seamlessly integrate custom functionality into your Tableau visualizations without manual communication or external documentation. When analysts need to leverage deployed models or functions, they can open the custom functions modal, easily discover functions and their specificities, copy the syntax to use a particular function, and seamlessly implement in downstream visualizations.
21. Accessibility Improvements
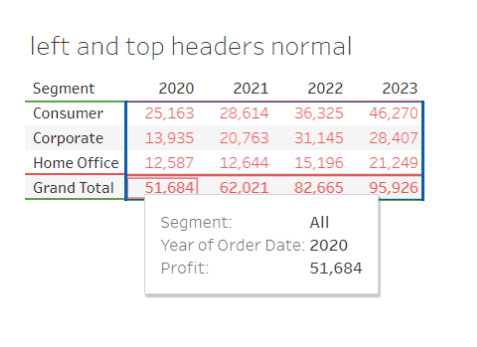
Explore, navigate, and interact with data visualizations, dashboards, and stories without relying on your mouse. Visualization Navigation, or Viz Navigation for Text Tables, introduces a new mode of data exploration that doesn’t rely on mouse interactivity. Straight from the Community Ideas Forum, you can use keyboard navigation and assistive technology to navigate the marks of a text table. If you are using a screen reader, you will hear the information for each tooltip. Viz Navigation for Text Tables gives authors a way to improve the accessibility of dashboards. For example, you can create a dashboard that has text tables as supplementary visualizations to more complex visualizations, enabling exploration of the data without needing to use the View Data experience.
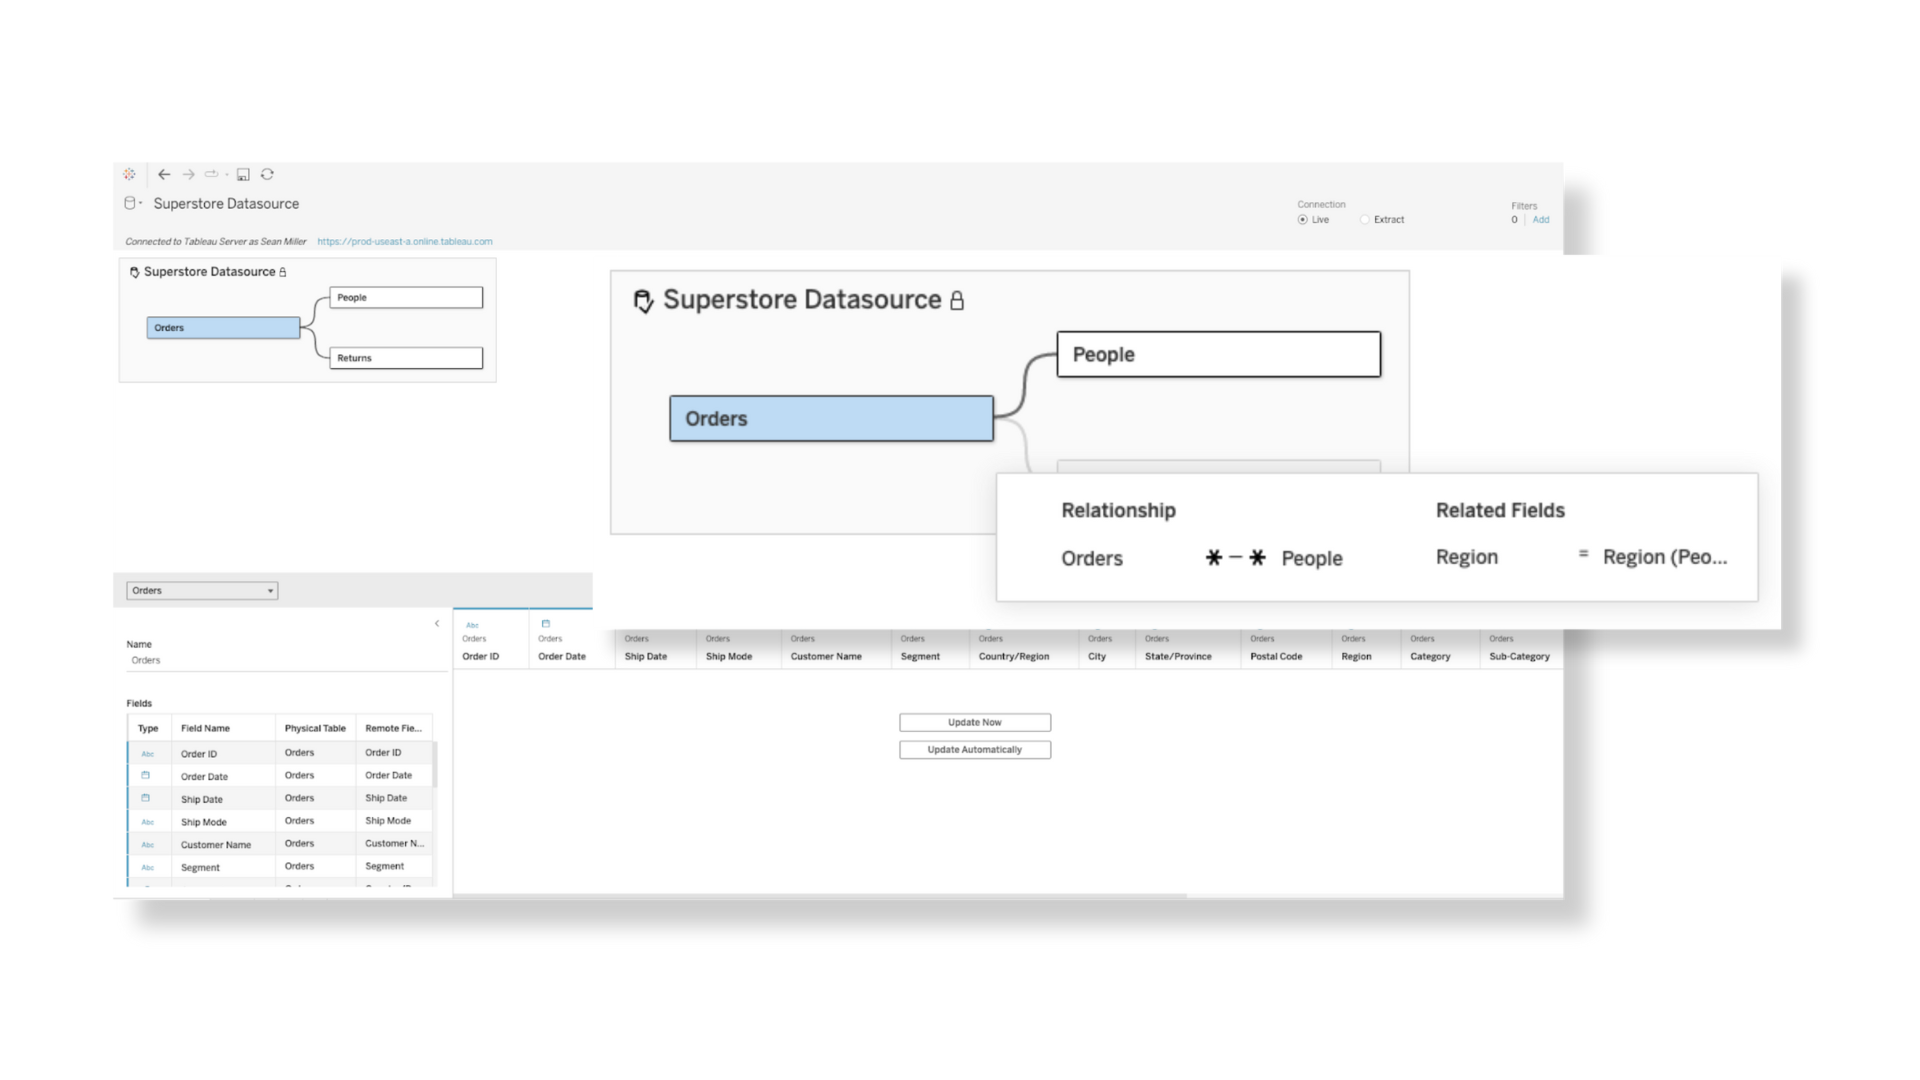
20. Display Data Model for Published Data Sources
Released in Tableau 2024.3
View and understand how tables in your data model are related with Display Data Model for Published Data Sources. Create accurate visualizations and understand the relationships between different tables and fields in Tableau by simply clicking the Data Source pane in a Tableau workbook.
19. Tableau Prep Conductor Supports Custom Schedules
Released in Tableau 2024.2
Streamline data management processes with enhanced flexibility in scheduling data preparation flows with Tableau Prep Conductor.
18. Authentication features
OpenID connectivity, multiple IdPs for a Cloud site, added SSO for Tableau ID, key pair authentication for Snowflake, and external identity provider for Snowflake.
17. Exchange on Tableau Public
Released in October 2024
Explore over 30 viz and dashboard extensions available for free directly on the Tableau Public homepage. These extensions expand the capabilities of Tableau Public—a free platform that allows you to explore, create, and share data visualizations—allowing you to easily incorporate new functionalities into your visualizations and dashboards, creating new opportunities to explore your data. Built by Tableau and our Partners, these extensions are available natively in Tableau Public web authoring and Tableau Desktop Public Edition. Enhance your Tableau Public storytelling with free extensions.
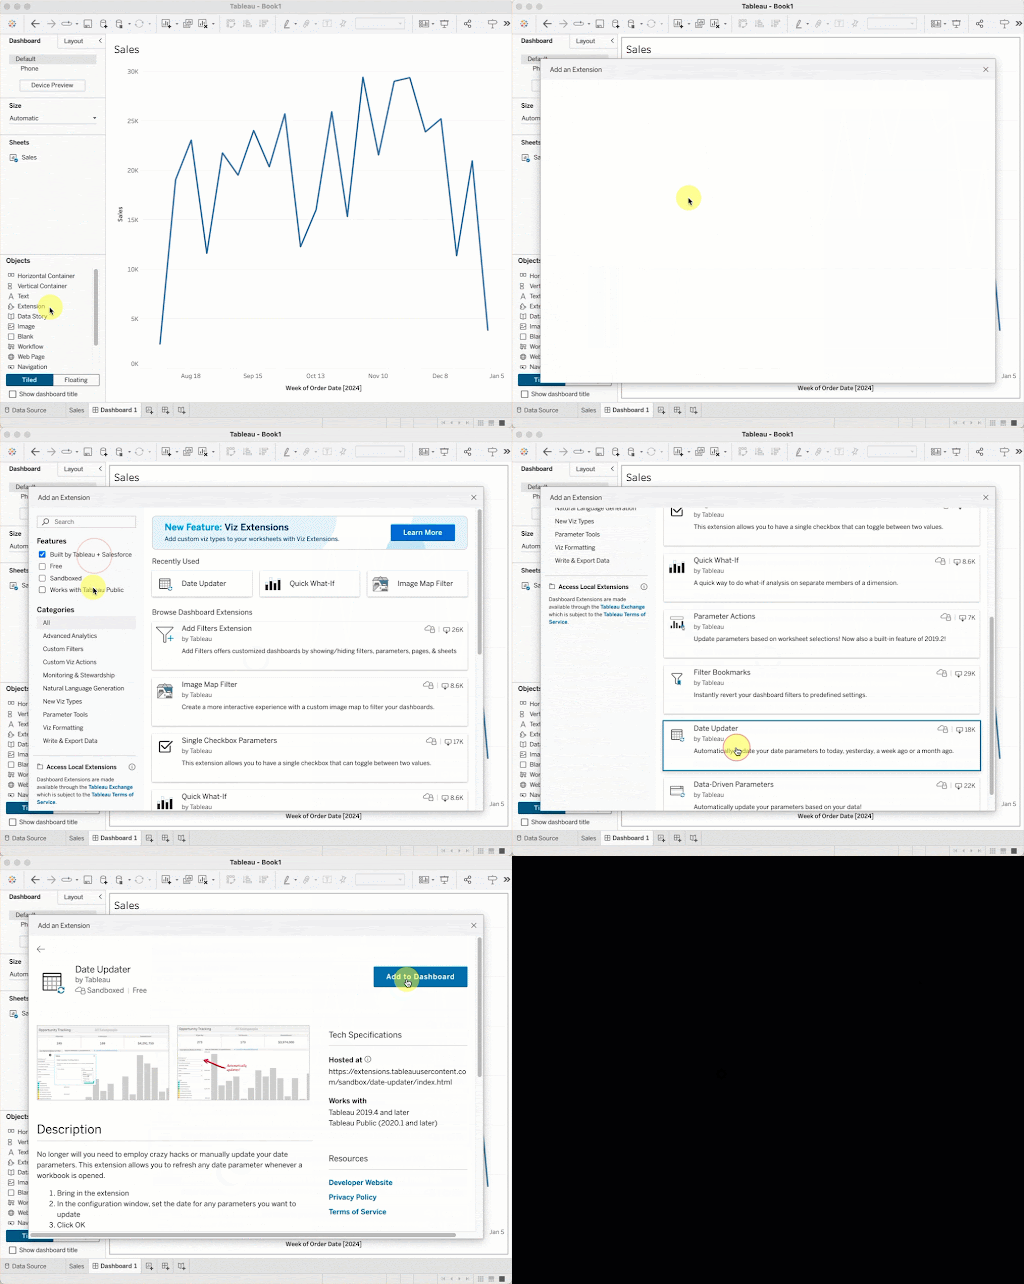
16. Incremental Extracts with Subrange Refresh
Keep data fresher and reduce costs associated with full extract refreshes by setting a date range to refresh for incremental refreshes.
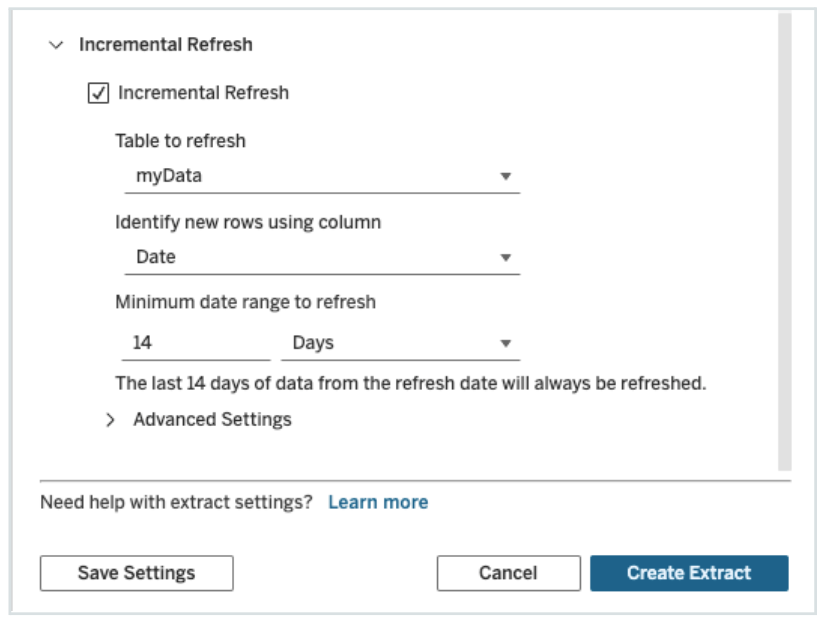
15. Spatial Parameters
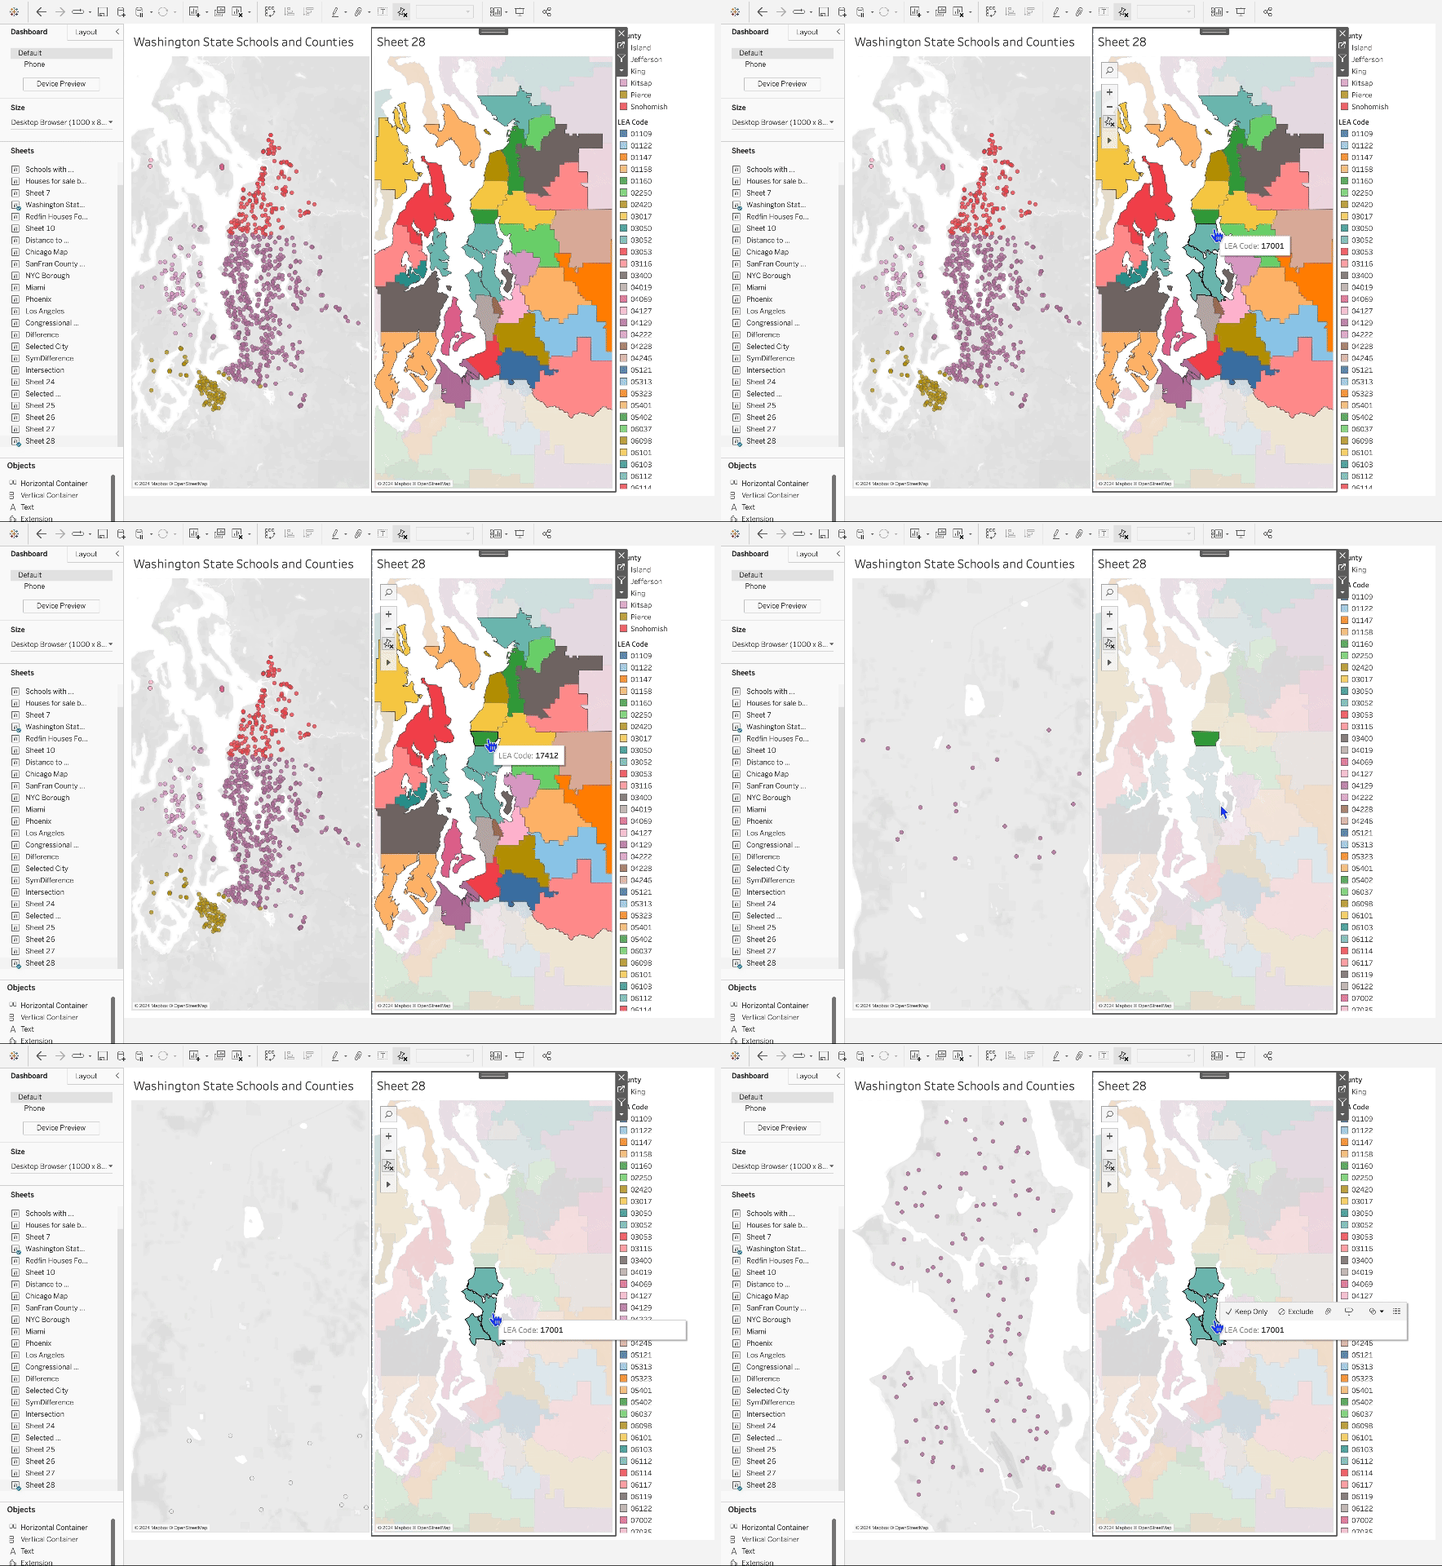
Bring the full Tableau experience to geospatial data with geospatial support for Parameters. Spatial Parameters create rich, interactive dashboards so users can ask and answer questions about geospatial data. With the Tableau 2024.3 release, we’ve added new mapping superpowers with Spatial Parameters, Spatial Calculations (Symdifference, Intersection, Difference) and Union Aggregation.
14. Migration SDK
Simplify and speed up migrations from Tableau Server to Tableau Cloud. The Migration SDK gives you the information and tools you need to build custom migration applications with C# and/or Python. With these tools, you can migrate users, permissions, projects, workbooks, data sources, metadata, and more.
13. Tableau Cloud Manager
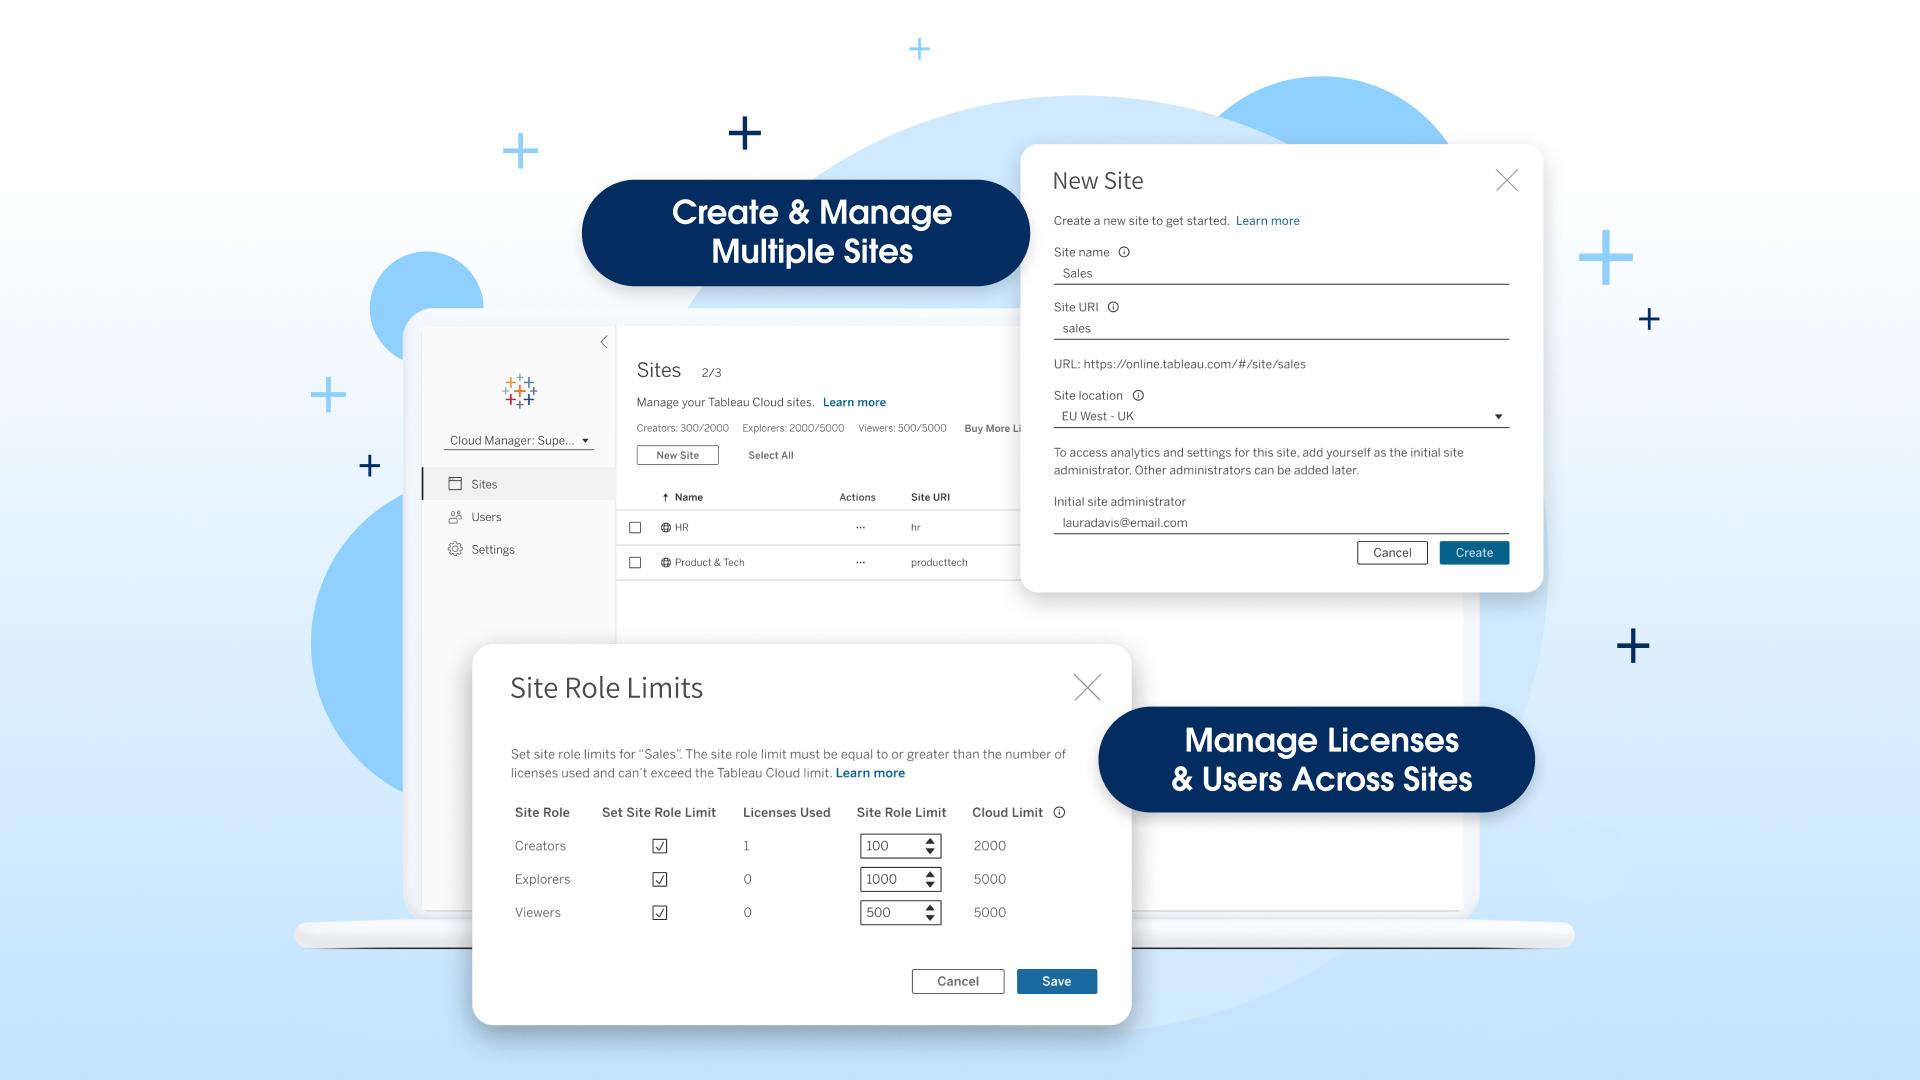
Tableau Cloud Manager allows admins to create and manage multiple Tableau sites in the regions of their choice. Admins can manage licenses and users across sites without having to license a single user multiple times. This simplifies the expansion and management of their cloud analytics environment while helping ensure they meet data residency requirements and maintain governance.
12. Tableau Desktop Public Edition Local File Save
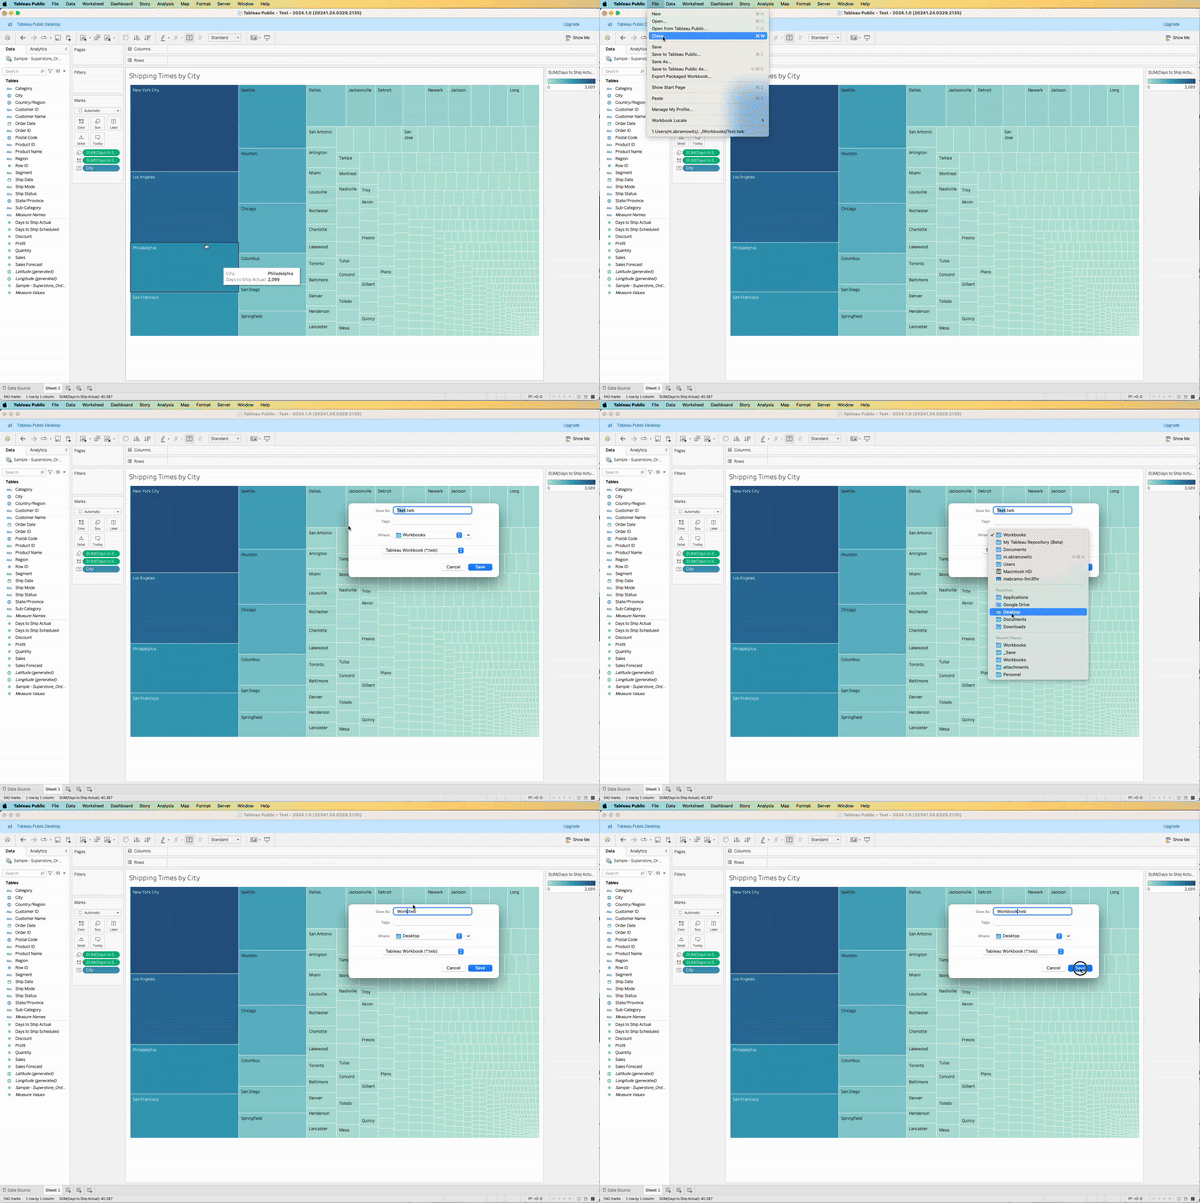
With the addition of local file saving to Tableau Desktop Public Edition, you can save unlimited workbooks to your local desktop, visualize public and private data, create and save visualizations on-the-go with no internet connection required, automatically save your work every few minutes with autorecovery, and perfect your data visualizations before publishing to your Tableau Public profile. Upgrade your existing version of Tableau Desktop Public Edition or download for free.
11. Autosave
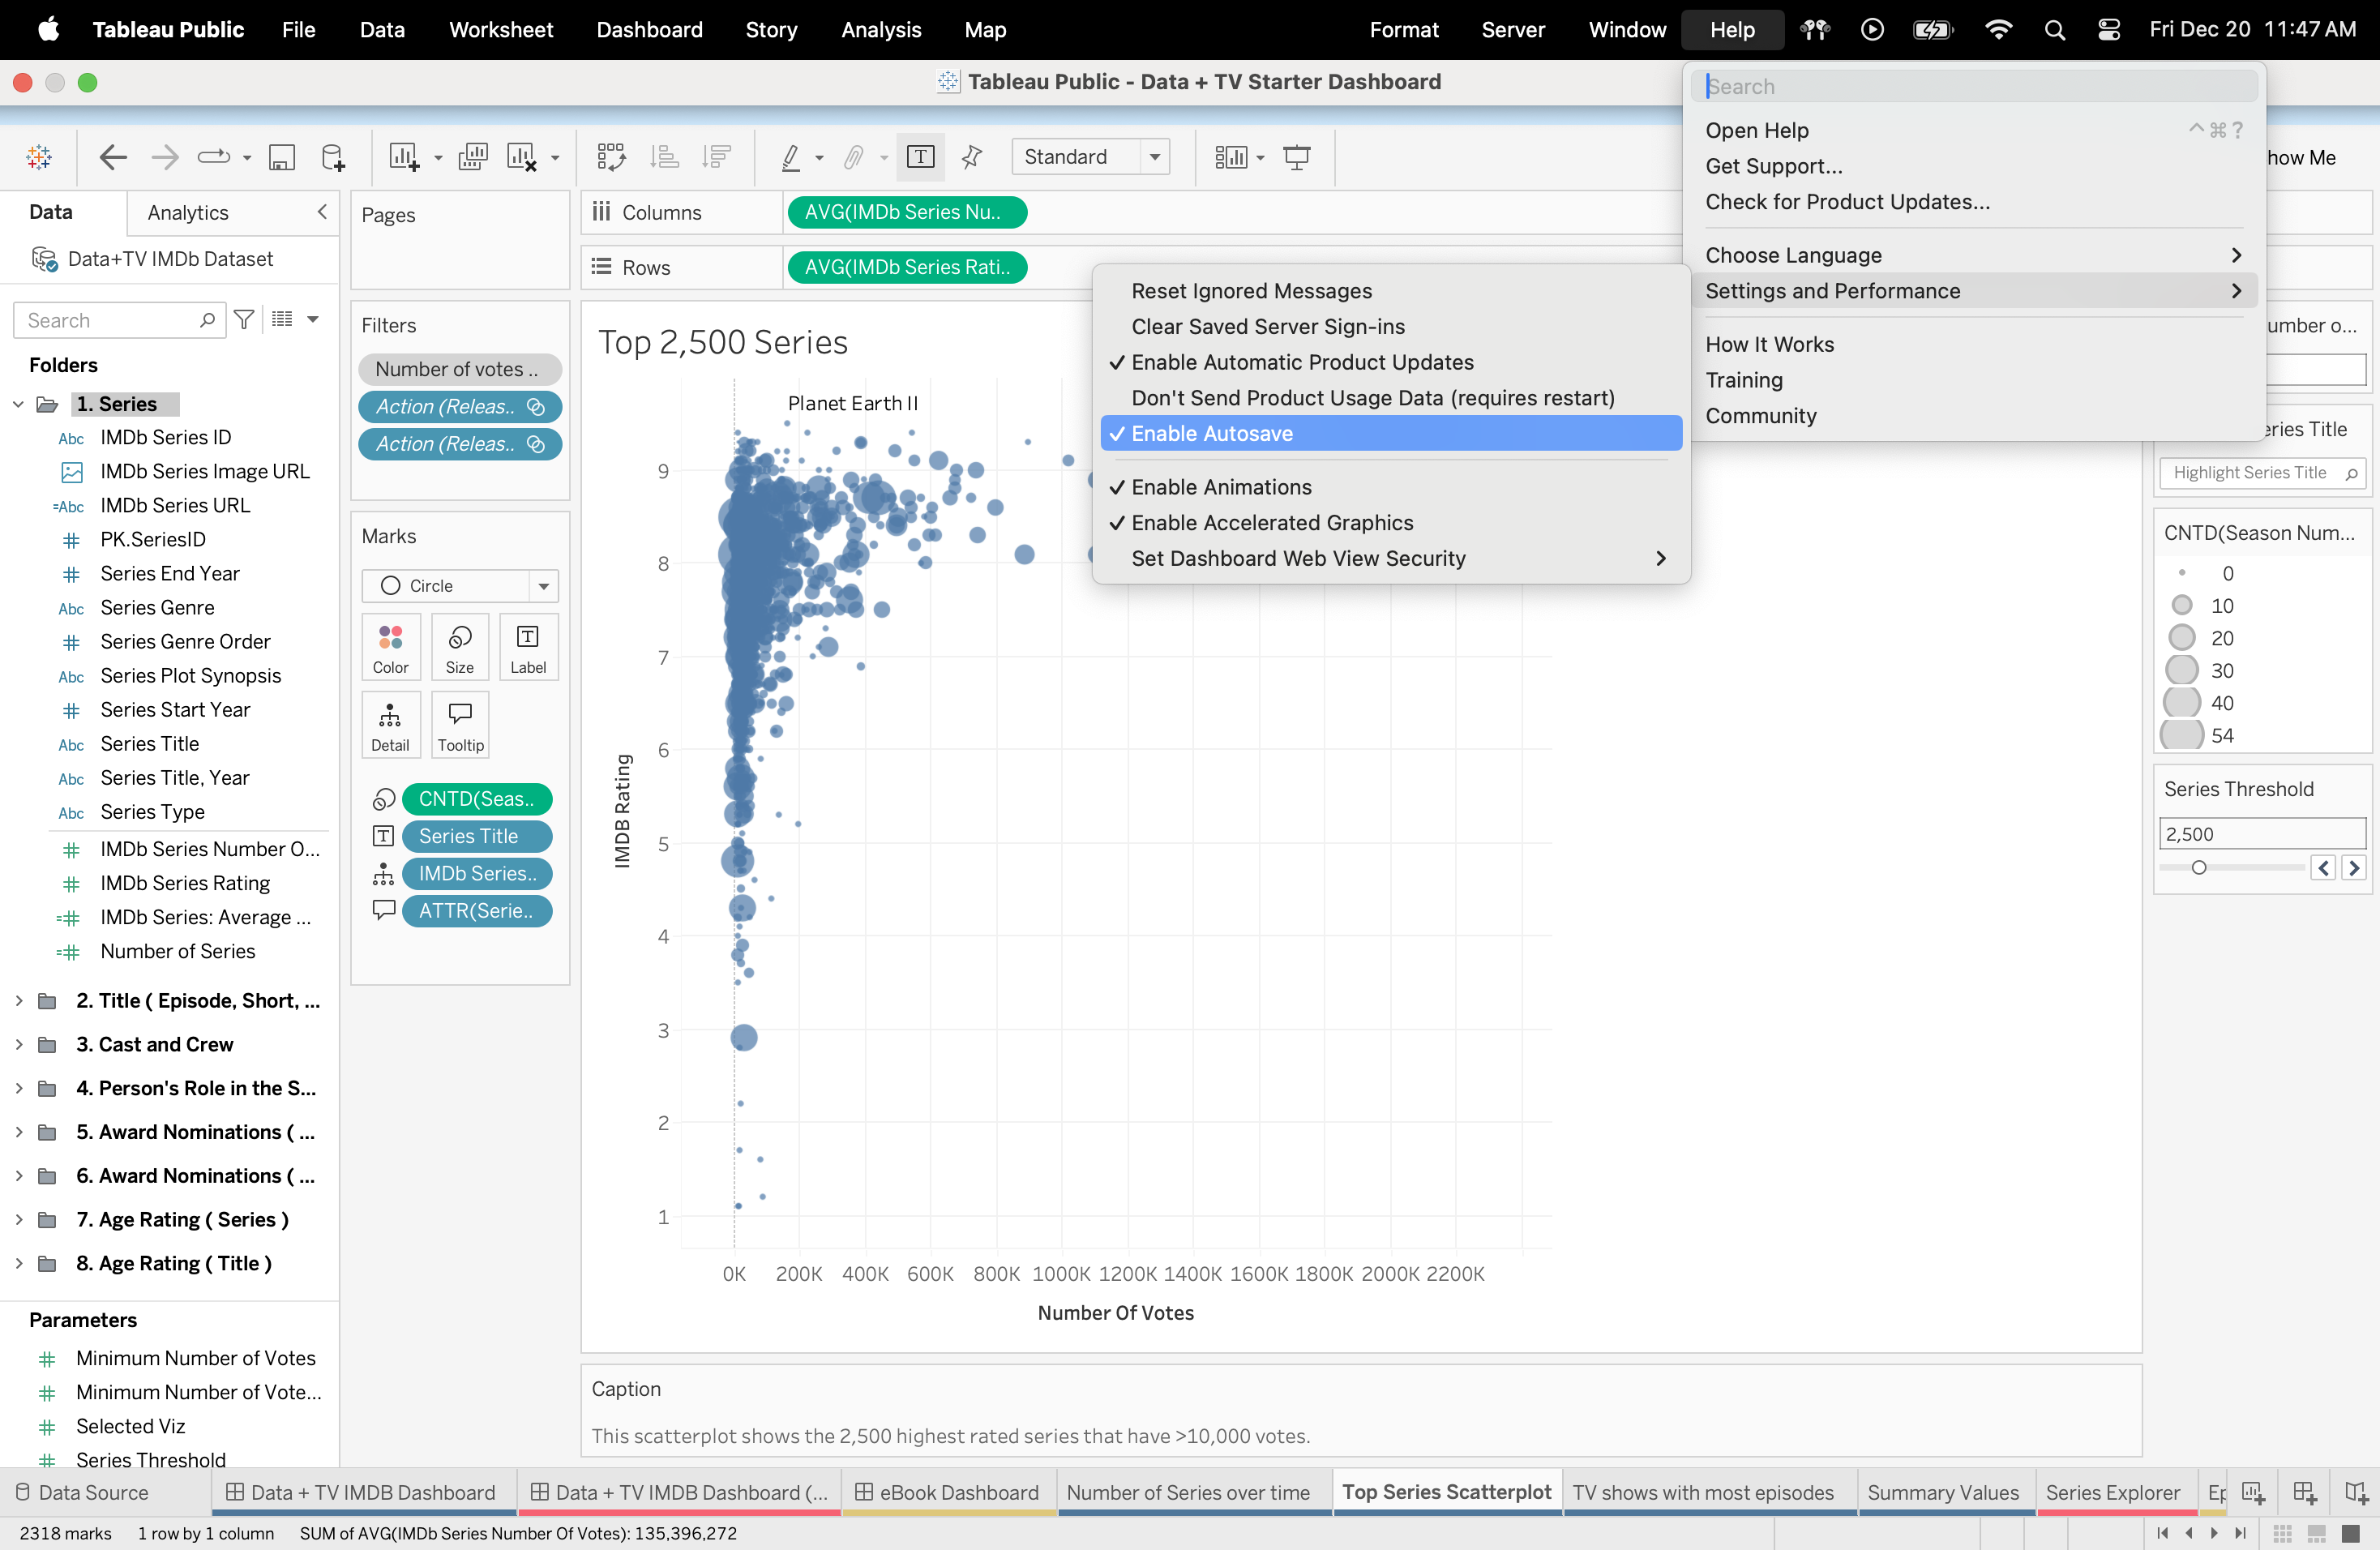
Tableau Desktop Public Edition automatically saves your work for you every few minutes. This feature is turned on by default. After 3 minutes, auto-save will begin saving your workbooks as you work within Tableau Desktop Public Edition.
10. Google Font Support
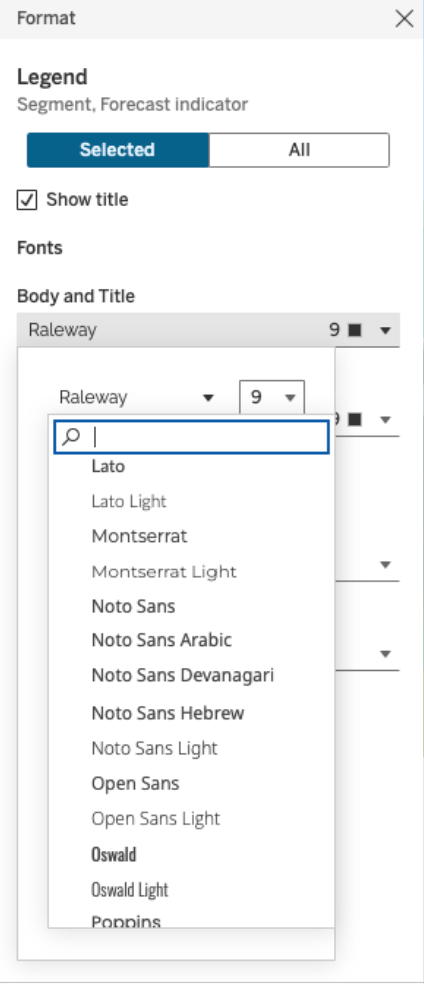
Get more font options in Tableau Cloud with support for a set of Google Fonts. Tableau Cloud now supports Lato, Montserrat, Noto Sans, Noto Sans Hebrew, Noto Sans Arabic, Noto Sans Devanagari, Open Sans, Oswald, Poppins, and Raleway.
9. Spell Check on Tableau Cloud and Server
Spell Check is now available on Tableau Cloud and Tableau Server web authoring. Spelling errors in online experiences will be identified and suggestions provided.
8. Viz Extensions
Released in 2024.2
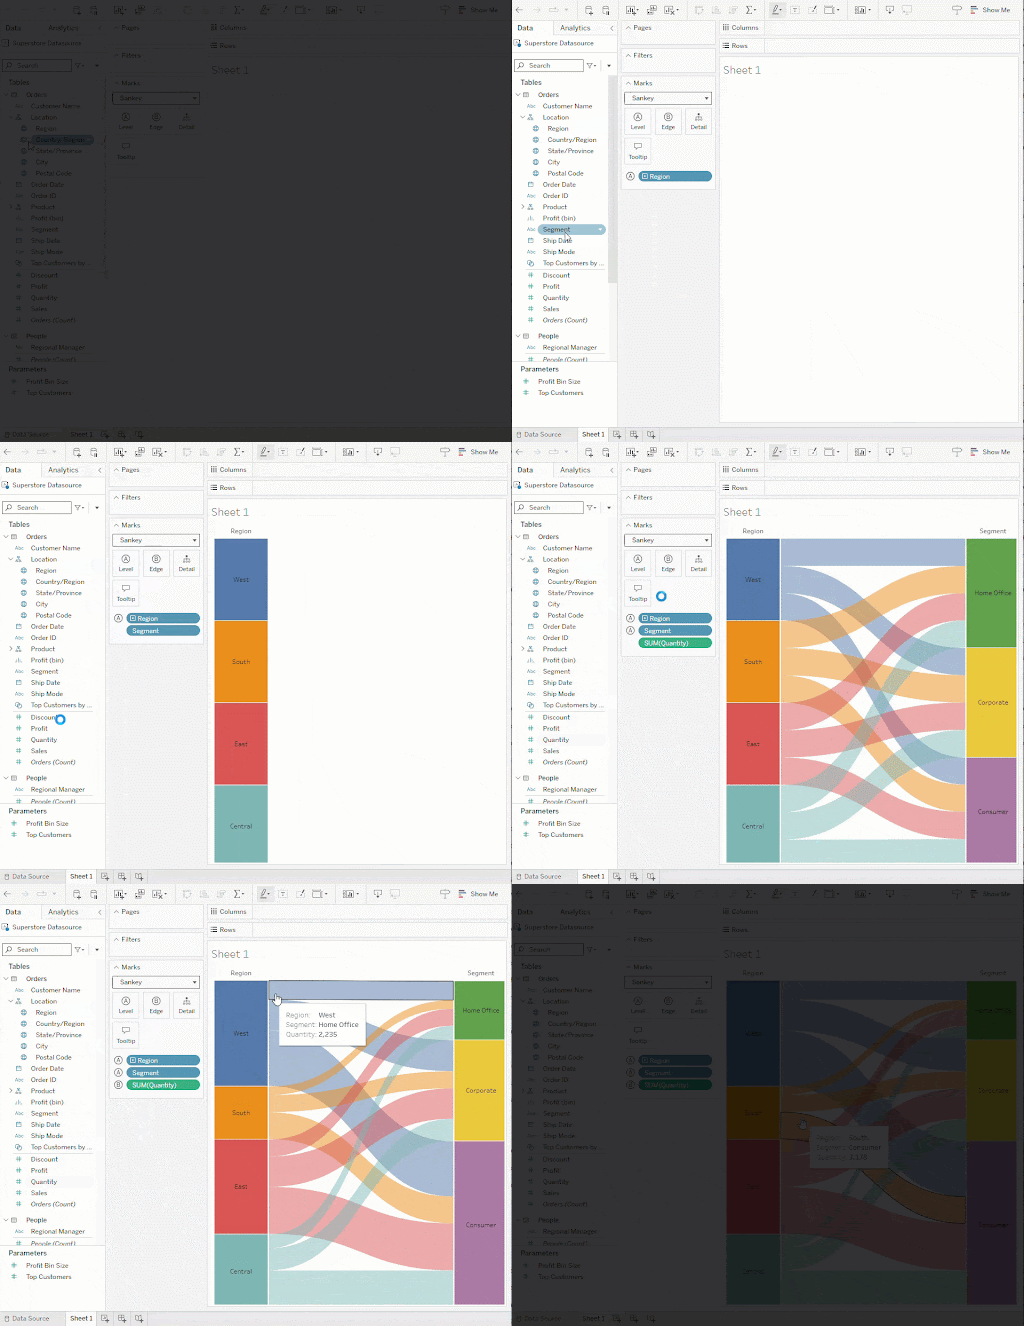
We brought you one of our highest voted ideas on the Tableau Community Forum—Viz Extensions. Viz Extensions broaden the capabilities of what Tableau can visualize, adding more tools for people to explore insights and present information in entirely new designs and layouts. In 2024.3, we delivered Table Viz Extensions. With this new Exchange built Viz Type, we tackled common functionality asks around column level sorting, conditional formatting, and copy to clipboard concepts. Analysts can now incorporate detail tables as a part of their dashboard, making it easier to connect with users who feel more comfortable interacting with data in a grid format.
7. Multi-fact Relationships and Multi-fact Relationship Infoscenting
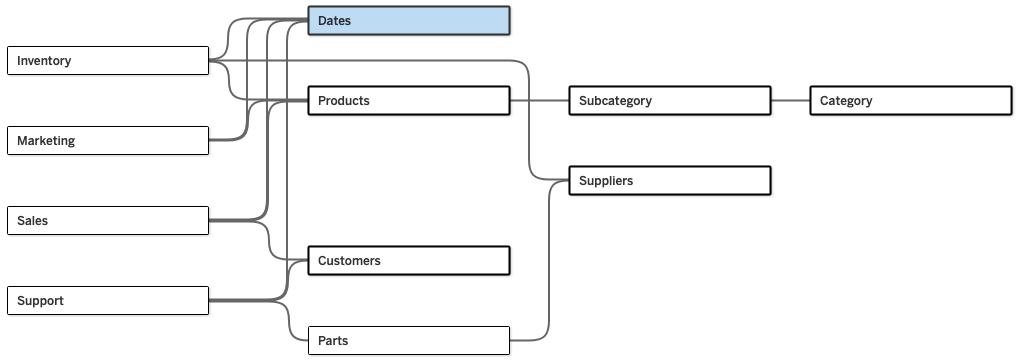
Multi-fact Relationships is a data modeling capability in Tableau that allows you to define the relationships between multiple fact tables to perform multi-fact analysis. This unlocks more comprehensive and holistic views of your data, simplifying the process of building more robust data models without extensive data engineering in Tableau.
6. Tableau App for Microsoft Teams
Released in 2024.3
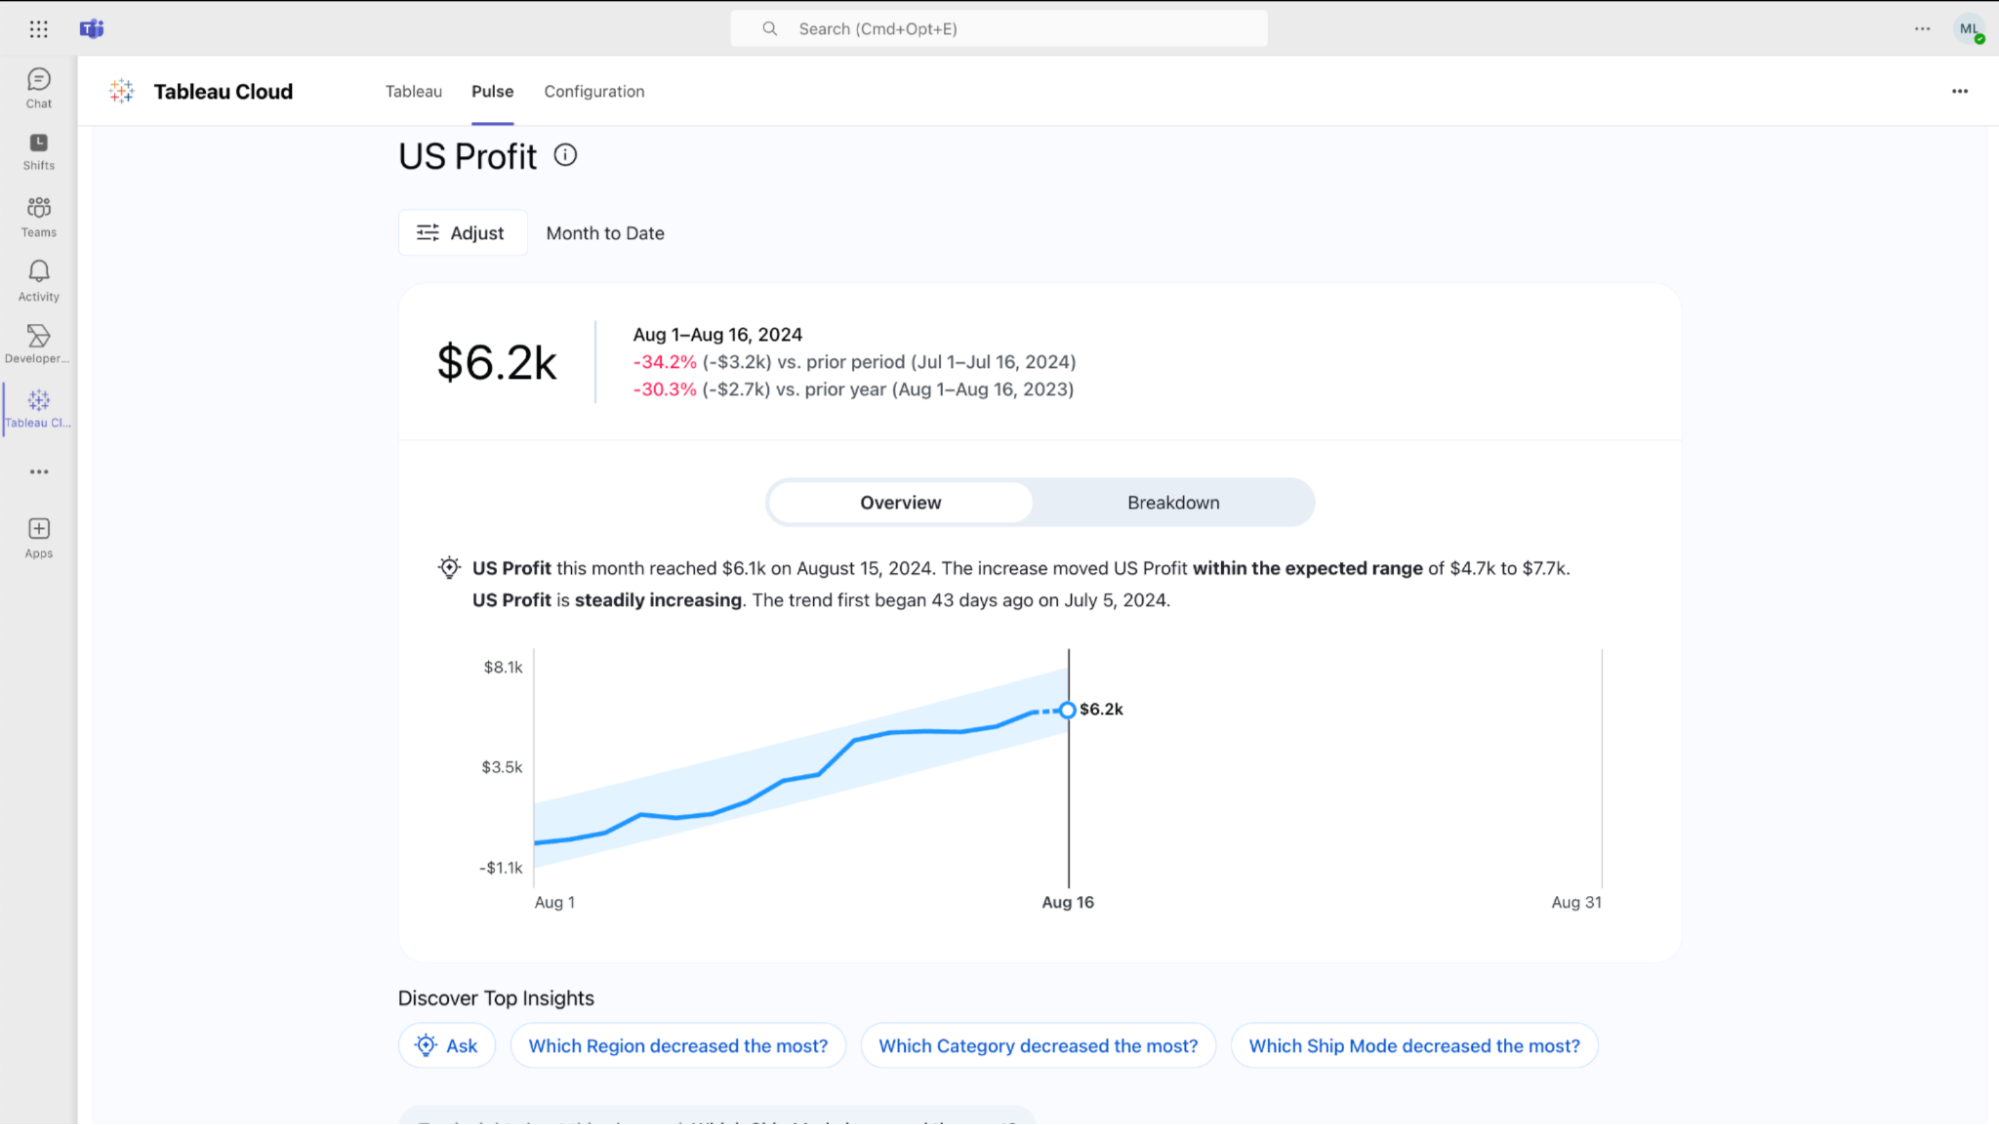
The release of the Tableau App for Microsoft Teams bridges the gap between Tableau's AI-powered analytics and Microsoft's collaboration hub. Users can now access, share, and interact with Tableau content, including dashboards and Tableau Pulse metrics, directly within Teams. This integration represents a major leap forward in Tableau's vision of bringing data to everyone, everywhere, eliminating the friction between where insights live and where decisions happen. The free app creates a unified space where data-driven conversations naturally flourish, demonstrating Tableau's commitment to meeting users where they work and making trusted insights a natural part of every business conversation.
5. Apple Silicon
Released in 2024.2
Customers can download and run Tableau natively on Mac computers that use Apple Silicon.
![]()
4. Tableau Agent: Prep
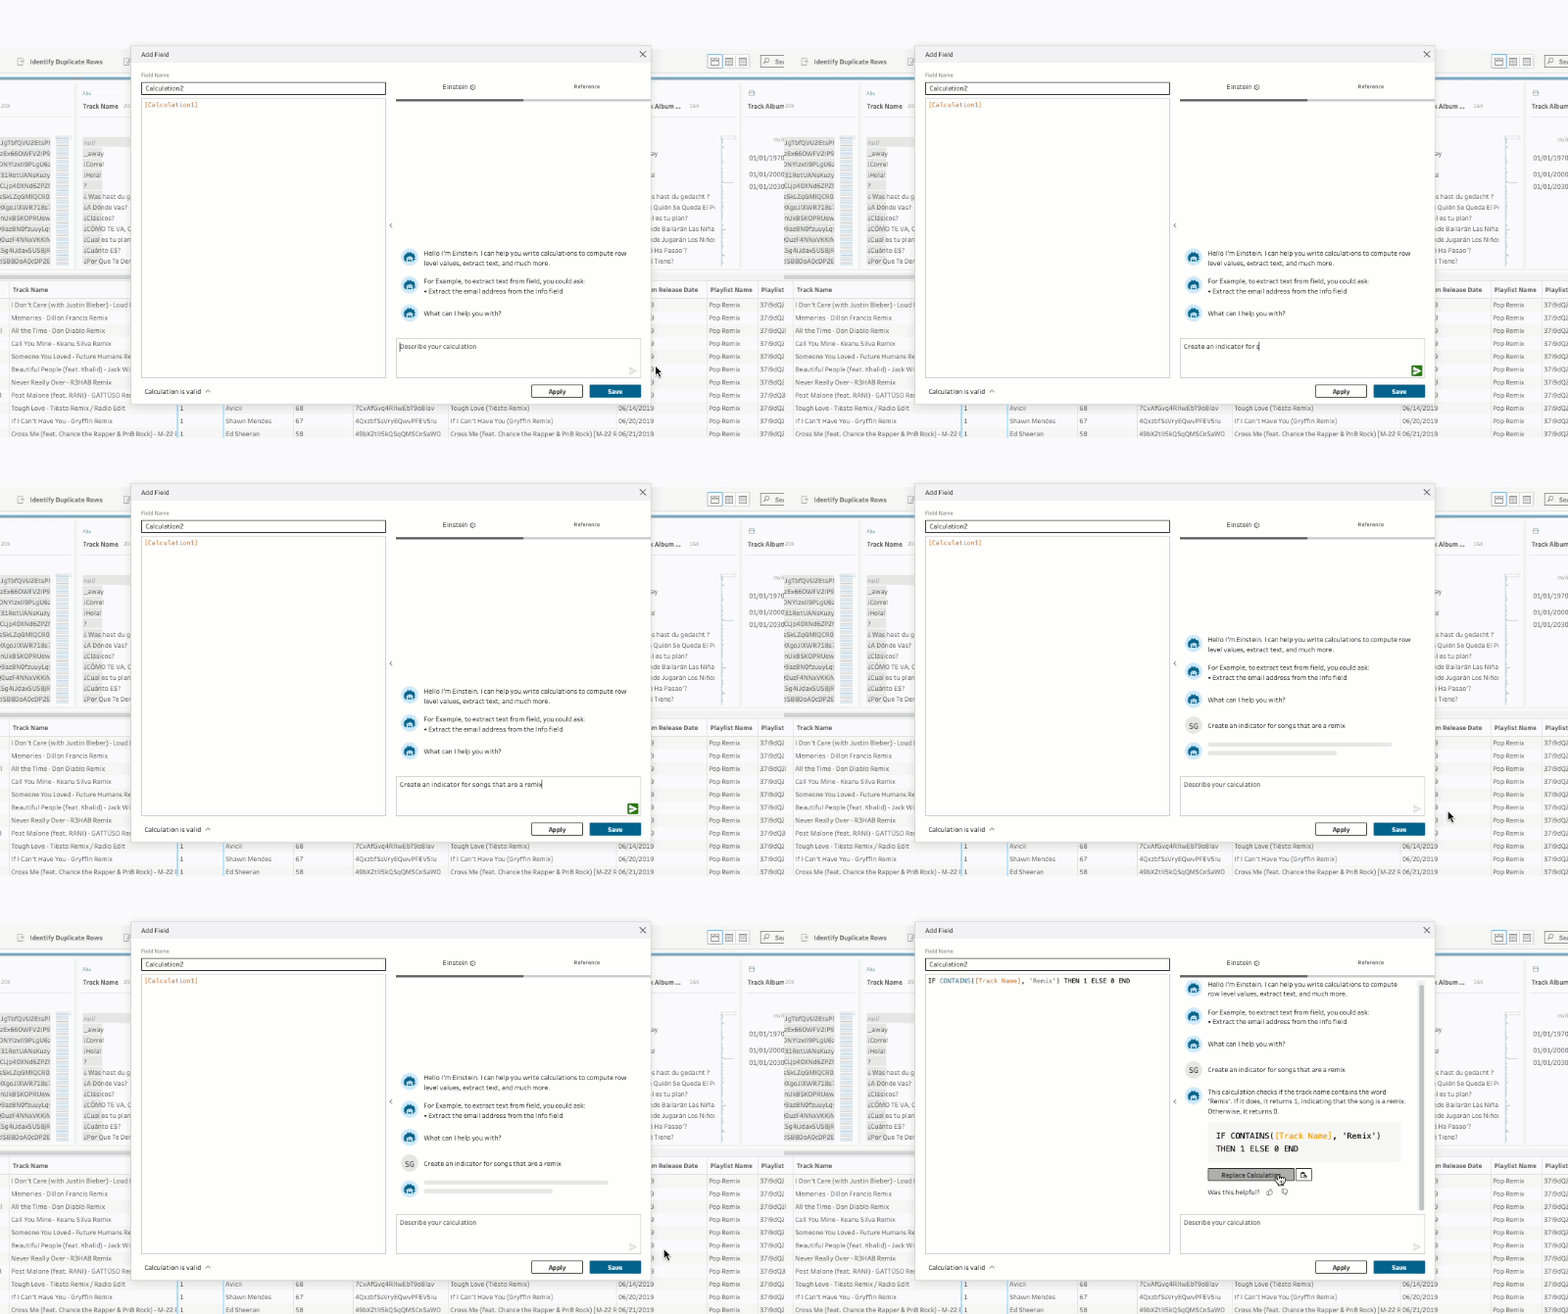
Tableau Agent for Tableau Prep helps you save time with data preparation. Simply describe your desired action in the ‘create calculated field’ dialog box, and Tableau Agent will return an accurate and robust result for you to apply. This allows you to add powerful calculated fields for your Prep flows with speed and ease.
3. Tableau Agent: Catalog
Effortlessly produce comprehensive descriptions for your data sources, workbooks, and tables in one click with the power of Tableau Agent for Catalog. Tableau Agent for Catalog helps you maintain data quality and strengthen data governance of your assets with AI-generated descriptions, leading with trust and confidence in your secure, certified data sources, and faster than ever before.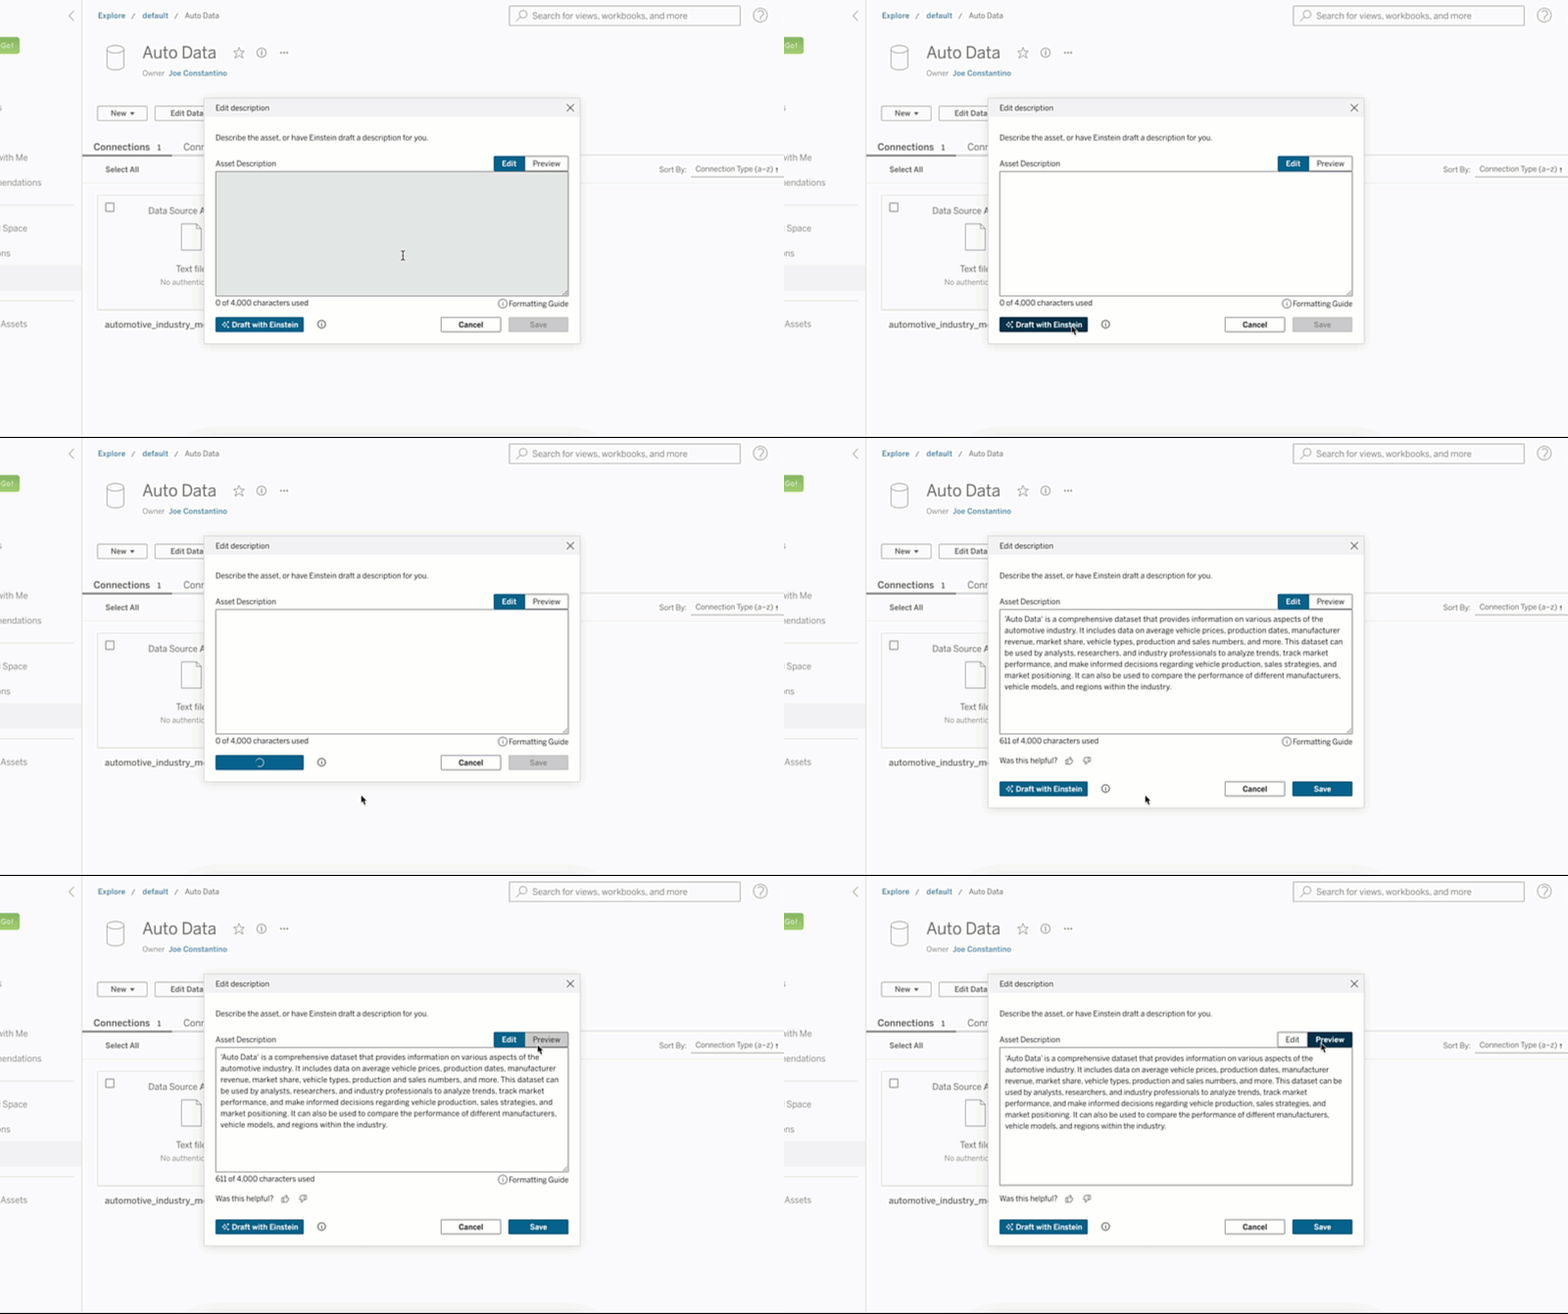
2. Tableau Agent: Web Authoring
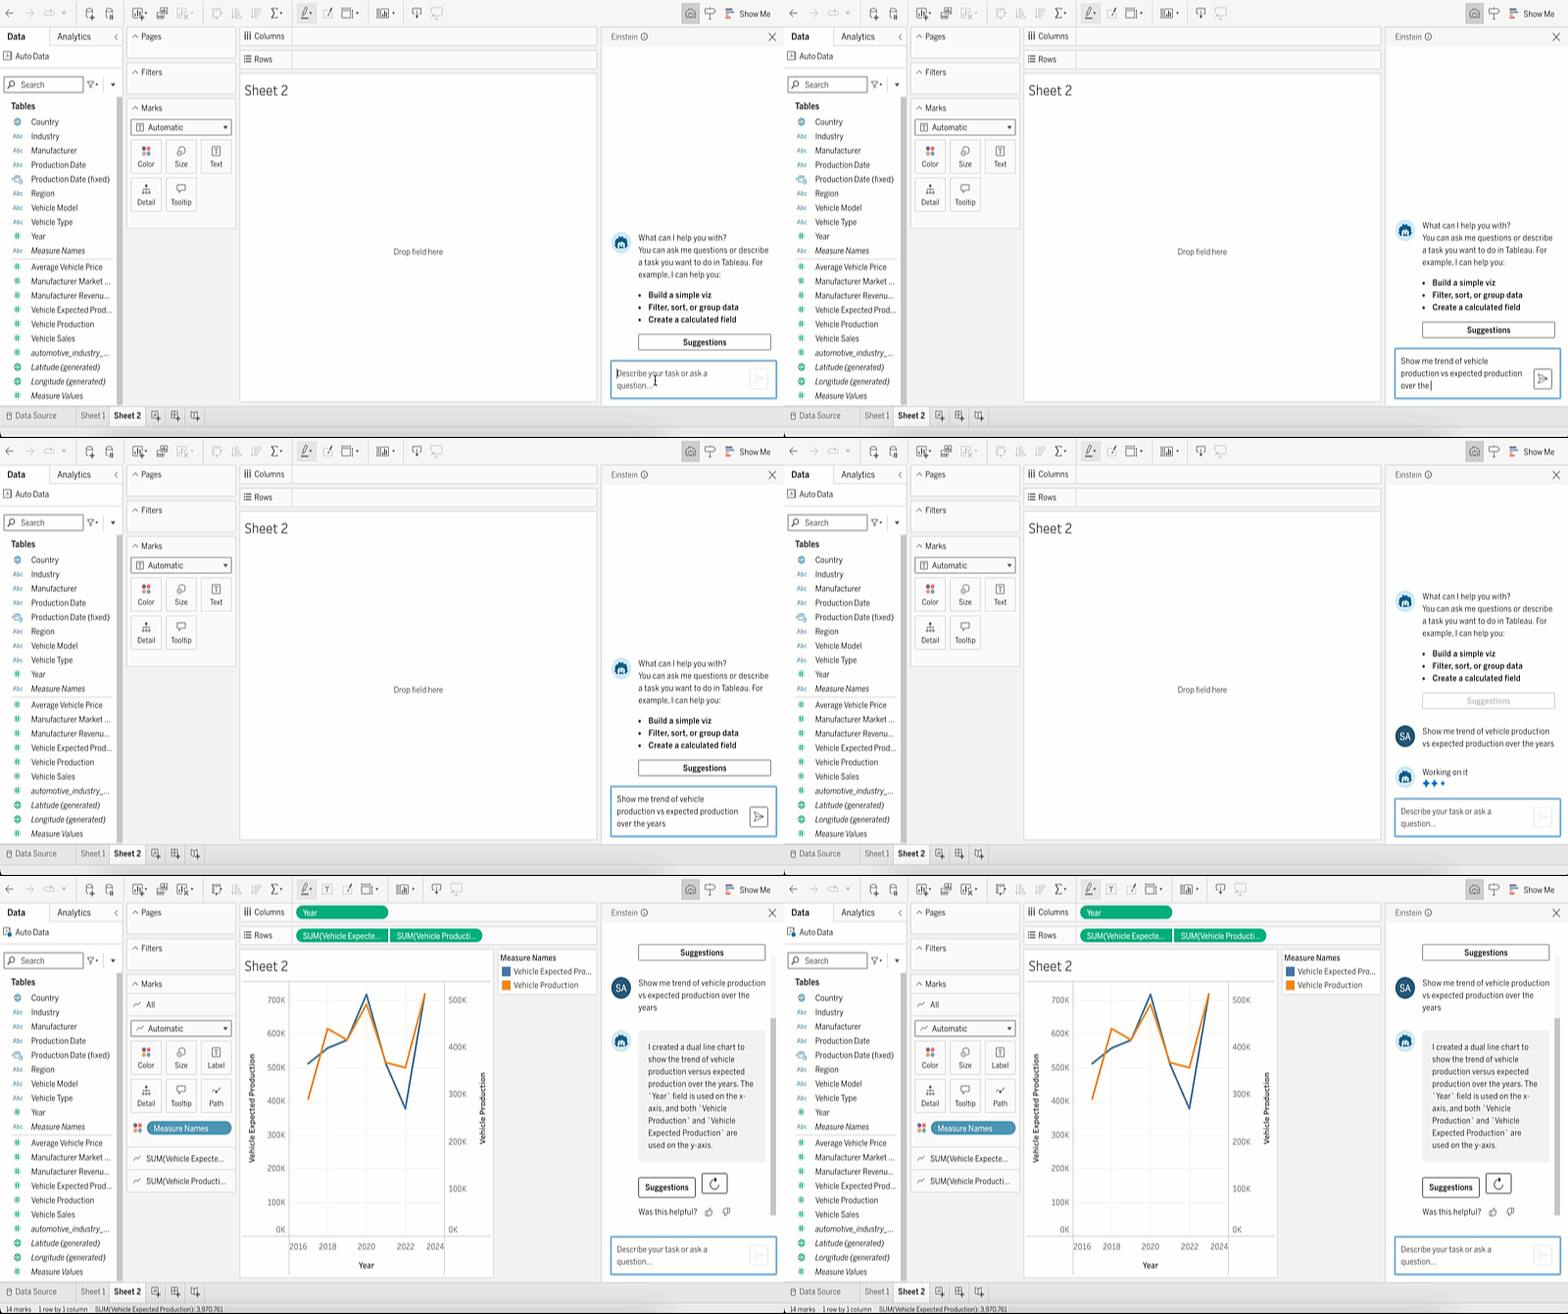
Explore your data with a trusted AI assistant using natural language directly from Tableau Cloud Web Authoring. Transform prompts into visualizations, formulate calculations to enhance your analysis, and get suggested questions based on your data. Tableau Agent will work with you, so you can move freely between manual drag and drop actions and formula editing to communicating requests with Tableau Agent.
1. Tableau Pulse
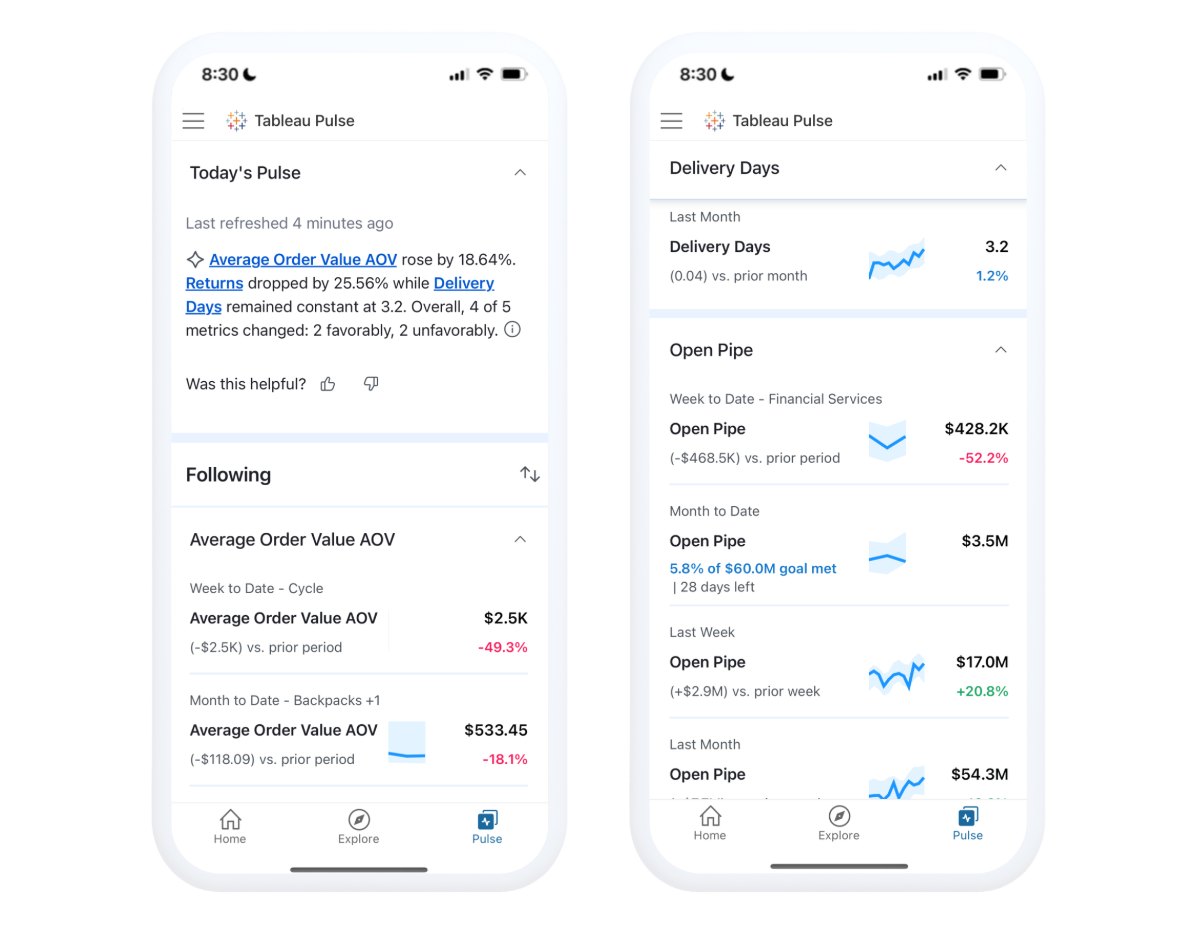
For businesses to truly capitalize on their data, they need to embrace it as a critical tool for decision making. Empowering every employee with data who could benefit from it can ultimately help companies succeed, enabling them to be more profitable, resilient, and competitive. Tableau Pulse is a reimagined data experience for analytics consumers that will empower every employee with smart, personalized, and contextual insights delivered directly in their flow of work. It will especially help users who don’t have time to learn new tools, need data at their fingertips to make decisions quickly, and who want to go beyond the “how” and “what” of data to understand the “why.”
Related Stories
Subscribe to our blog
Get the latest Tableau updates in your inbox.


