How to analyze Salesforce Service Cloud data smarter with Tableau Dashboard Starters
Every department in an organization should be able to understand their data—and customer service organizations are no exception—which is why we’re excited to add the Service Overview and the Case Tracking dashboards to our collection of starters. These two Dashboard Starters are specifically made for the Salesforce Service Cloud and are a great launching pad for anyone introducing analytics to their service organization.
The key to building a customer-focused organization is effective customer service. With every touchpoint, there are opportunities to increase operational efficiency and productivity, improve customer satisfaction, and build customer loyalty. High-performing service teams are 1.6 times more likely to use analytics to improve service. However, there are many pain points to getting started: there’s a wealth of data available coming from a variety of tools, traditional governance models prevent users from accessing data, and on top of everything it can be hard to find insights in complex data. The result is that customer service teams lack direction on how to improve and make their customers happy.
Every department in an organization should be able to understand their data—and customer service organizations are no exception—which is why we’re excited to add the Service Overview and the Case Tracking dashboards to our collection of starters. These two Dashboard Starters are specifically made for the Salesforce Service Cloud and are a great launching pad for anyone introducing analytics to their service organization. Salesforce puts customer experience at the center of every conversation, and now, you can use the power of Tableau’s new Dashboard Starters to discover insights and make data-driven decisions in your service organization.
Getting started with Service Cloud Dashboard Starters
All of our Dashboard Starters are available on Tableau Online—simply create a new workbook and connect to Dashboard Starters when you’re building a workbook in Tableau Online (to learn how, follow the steps in this Help article). For Service Cloud, select and open the Service Overview and Case Tracking starters. If you don’t have Tableau Online, you can start a free trial. Alternatively, you can download the Dashboard starters from our website. We have a whole collection of Salesforce Dashboard Starters available for you to try.
Service Overview Dashboard Starter
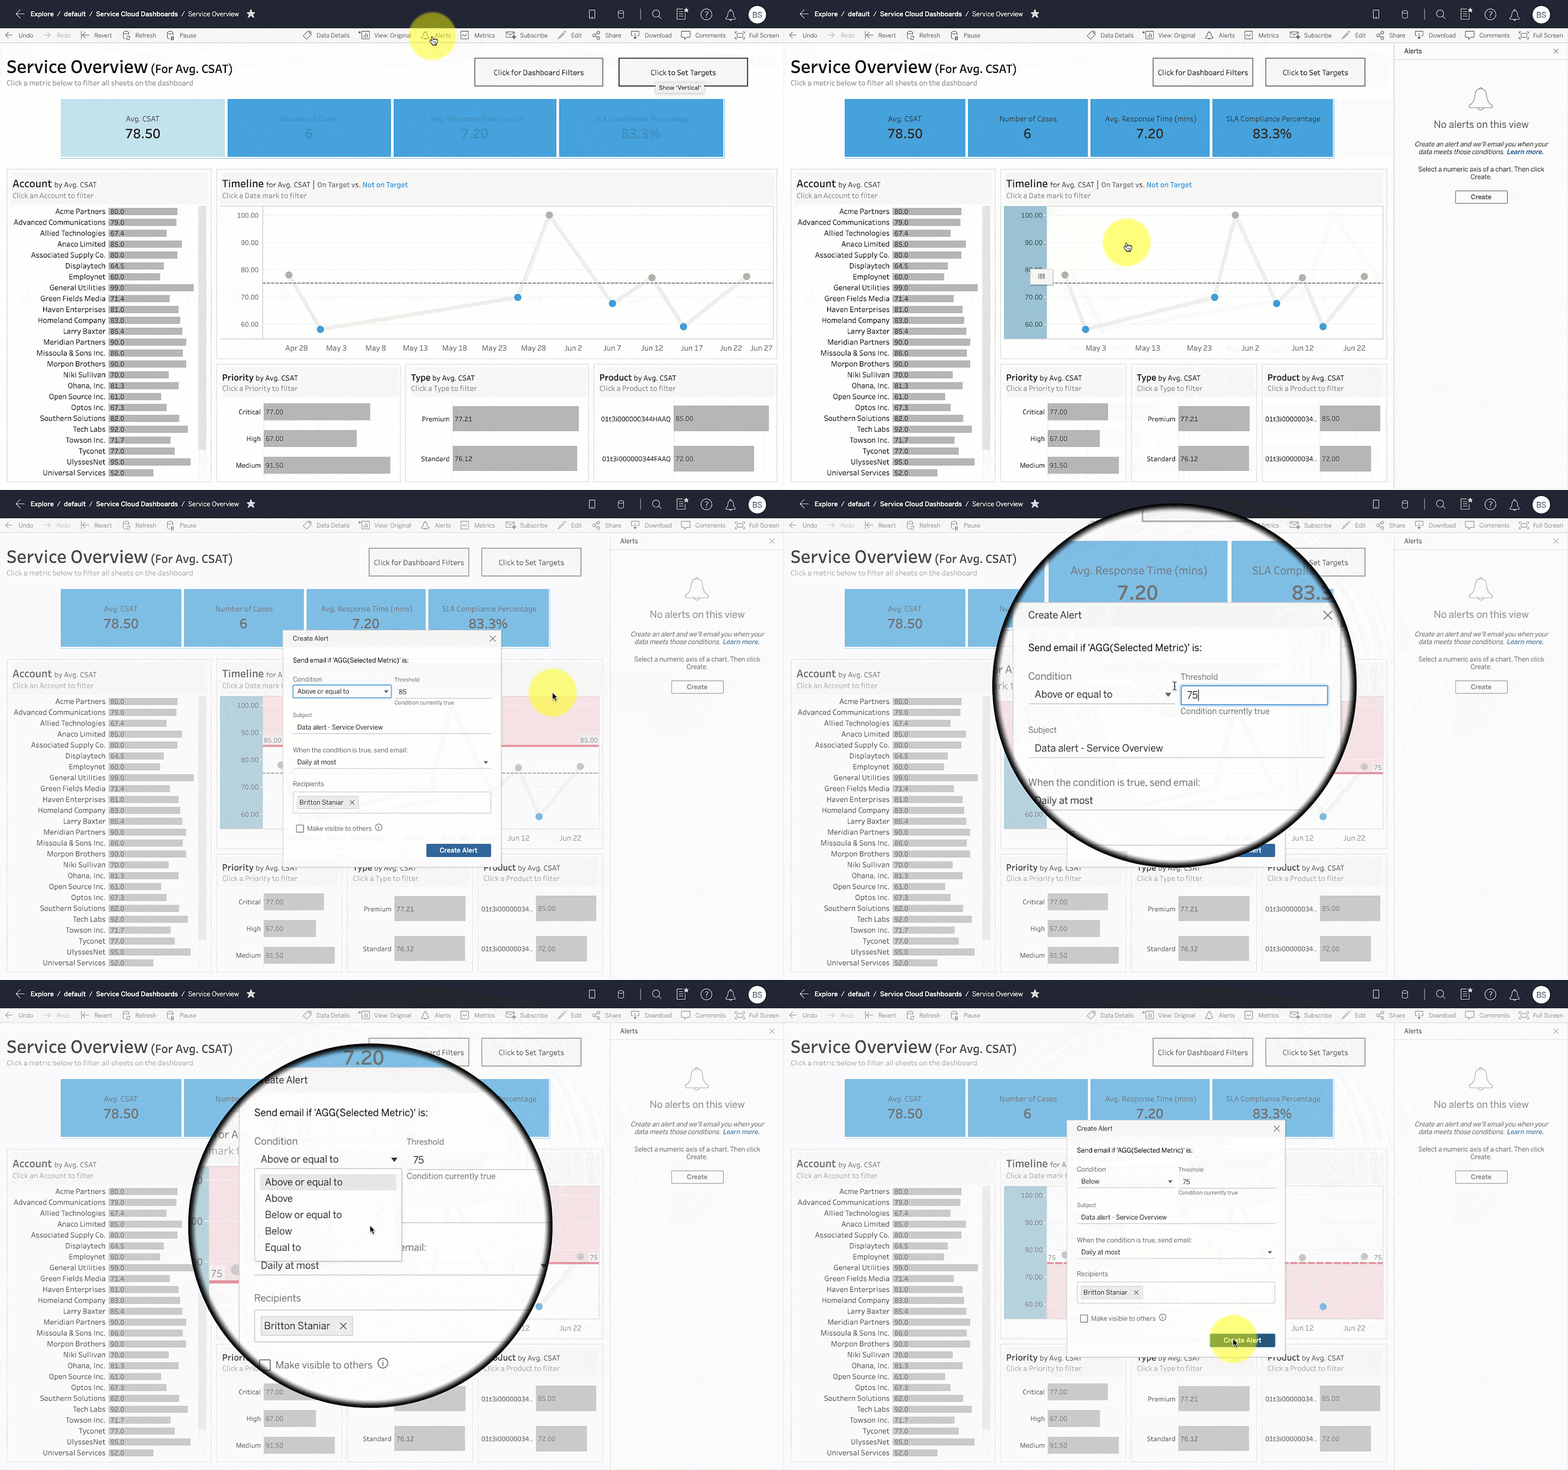
Use the Service Overview dashboard to get a high-level rundown of your business across important metrics like CSAT, number of cases, response time, and SLA compliance. Select a metric at the top to filter all of the views on the dashboard and then drill into cases by selecting individual marks on a view.

With the Service Overview dashboard you can come to a consensus on what good customer service looks like in your organization. Each metric has a customizable target on the dashboard that can be used to set benchmarks for your organization and alerts can be set on Tableau Online for users to get notified. Filter to see information for different time periods, geographies, and more.

Case Tracking Dashboard Starter
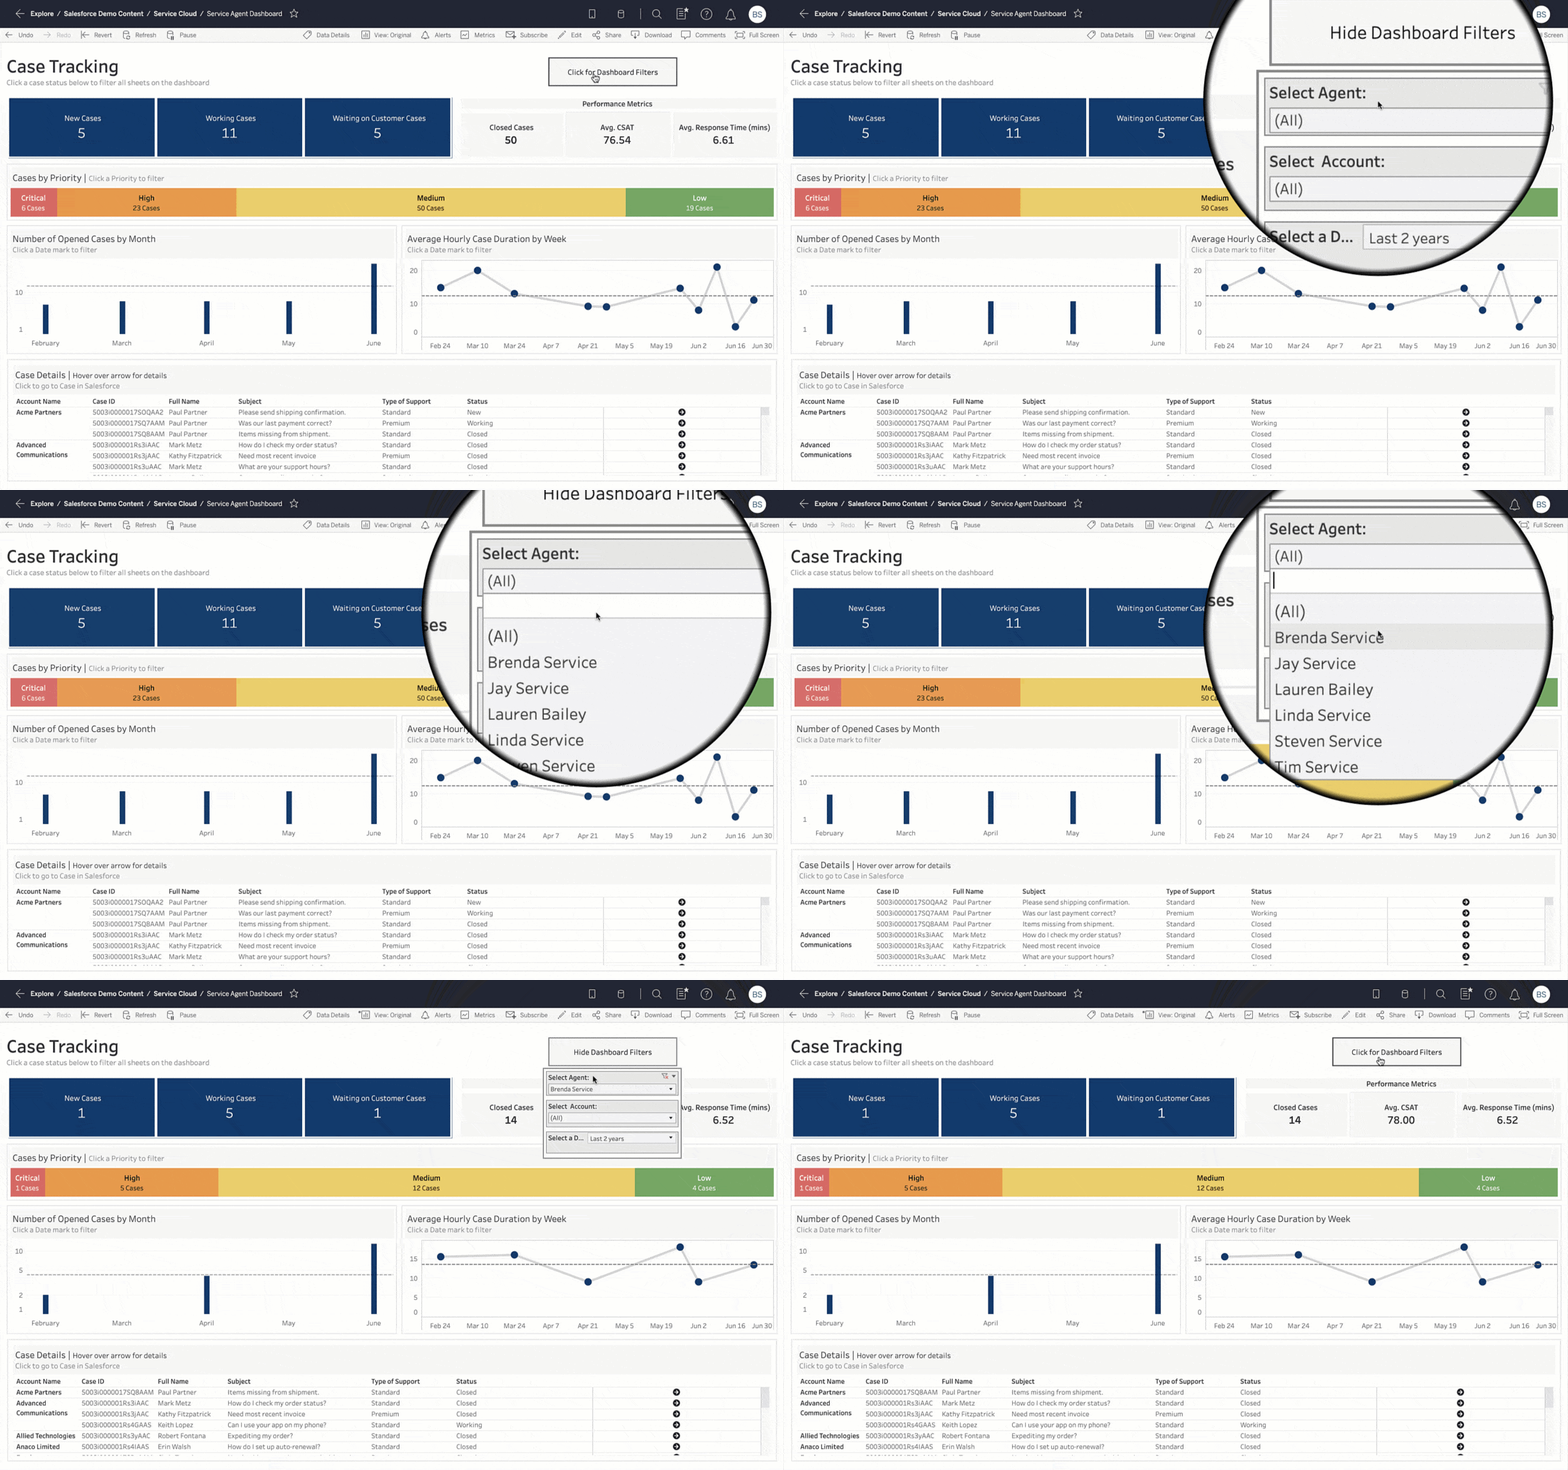
The Case Tracking dashboard allows agents to monitor their case queue and performance over time. Filter the dashboard to an individual agent and then drill into trends over time to discover potential opportunities for improvement.

The Case Tracking dashboard also allows you to drill into case details. Add in your Salesforce URL (make sure the parameter is inputted correctly) and return to the dashboard. Use the arrow on the case details worksheet to jump directly into the case in Salesforce.

Sharing and customizing the Dashboard Starters
These Service Cloud starters are meant to be a starting point. The possibilities are limitless! You can do anything from:
- Publish your starters and then set alerts and subscriptions to share with your teams.
- Add data and create visualizations from other data sources from important source systems to enrich your analysis.
- Create new KPIs, build custom calculations, and modify the starters to match how your organization provides service.
- Use custom colors to match your organization's branding.
Plugging your own data into the Dashboard Starter
These starters use sample data. If you want to add your own data you will need to connect to your Salesforce instance.
- Select the Data Source tab. A dialog box will appear prompting you for your application credentials (i.e. Salesforce username and password).
- Enter your credentials and log in to your account. You’ll need to ensure your account has API access to your Salesforce instance with your Salesforce admin.
- Now, go back to the dashboard. Tableau Desktop will then create an extract of your data. This process will vary based on how much data you have in your Salesforce instance.
- If any worksheets appear blank, navigate to the blank worksheet. Replace reference fields by right-clicking on the fields with red exclamation marks as necessary.
Making the most of the new Service Overview and Case Tracking Dashboard Starters can organize and analyze the wealth of data gained from every customer interaction. Being able to elevate insights empowers service teams to take action, resulting in lower call volumes, faster resolution times, and improved workflows. From the release of the Tableau Viz Lightning Web Component to the enhancements in Tableau’s connector to Salesforce, there’s never been a better time to start analyzing your data in Tableau and these Dashboard Starters are just the beginning of what is to come with Tableau and Salesforce.
Additional resources:
Related Stories
Subscribe to our blog
Get the latest Tableau updates in your inbox.


