This first-of-its-kind resource presents data on a range of metrics—from budgets to accountability to racial bias—on over 16,000 US police and sheriffs departments.
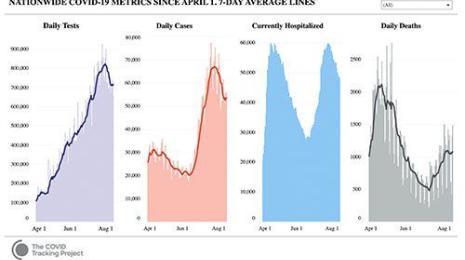
The team behind the COVID Tracking Project did not expect to be here right now. Learn how the COVID Tracking Project built one of the most widely used coronavirus datasets of the pandemic.
COVID-19 stands out as the largest and most widespread disease outbreak we’ve had to confront. Let’s look back into history to see how outbreaks in the past gave rise to practices that still inform how we manage and understand diseases today.
For those that want to contribute to the conversation or educate yourself further, we’ve compiled several resources on the complexities of the data and the context surrounding it. Here's what you should know.
We know that many members of the Tableau community will be interested in visualizing data on everything from police brutality to systemic inequities to celebrations of Black success and more. We outline several important things to keep in mind when working with this data and welcome your feedback for more considerations that should be added to this list.
As COVID-19 has progressed through the U.S. and states have implemented stay-at-home orders, nearly everyone’s lives have been disrupted. For schools and the kids who attend them, these changes have been particularly challenging. Instead of sitting with each other in classrooms, students are attending courses remotely, and interacting even more over screens than in real life. Without the usual face-to-face interactions, teachers are struggling to figure out how to assess student engagement and progress, and make sure their kids are feeling supported.
We’re now at the point where many countries, the U.S. included, are starting to look to the future and what needs to happen in order to safely begin to reopen parts of the economy. While the path forward is still uncertain, we’re beginning to understand that social distancing may be a fixture for many more months to come. A team of scientists at Harvard modeled the data and predicted that in the U.S., we may have to practice social distancing, at least in some capacity, through 2022.
The spread of COVID-19 around the world has set off a spike of interest in data visualizations. Everyone wants to see and understand how case counts are rising, what kind of impact the virus might have on themselves and their community, and what role they can play in slowing the spread.