Meet the Tableau Social Media Ambassadors
We'd like to introduce you to our 15 Social Media Ambassadors!
Part of our Tableau Ambassador program, these folks spend countless hours each week writing helpful blog posts, curating useful resources, and answering people's questions on social media.
Looking for help with a specific Tableau feature, or just wanting to say hi? Find an ambassador below and reach out on social media!

Specialties: Data storytelling, effective design, color
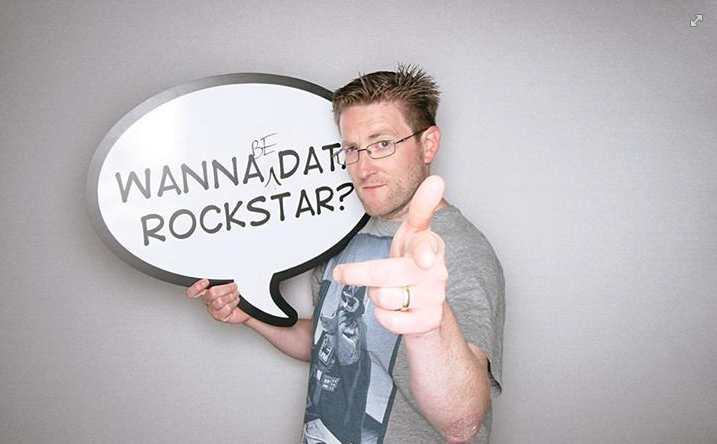
Blog: Wannabe Data Rock Star
From Twitter to Vimeo, to his blog, Matt shares content that's both entertaining and educational. He also co-hosts the Tableau Wanna Be Podcast with Emily Kund.

Specialties: Tableau training, survey data, fonts
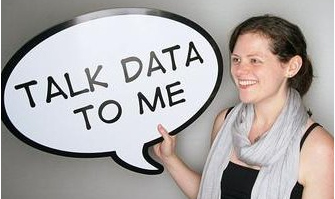
Blog: Woman in Data
A Tableau and Alteryx consultant and certified Tableau trainer, Emma helps organizations with all kinds of data. Her specialties are fonts and device-specific design, which she presented on at the 2015 Tableau Fringe Festival.

Specialties: Tableau training, community building, server administration
Blog: Tableau Awesomeness
An accredited Tableau Desktop trainer, Jen's specialty is helping organizations implement Tableau. But her blog covers everything from data storytelling to user groups, to the Tableau Fringe Festival (which she co-organizes). If you're looking for tips on fostering community, training users, or building a data culture, Jen is here to help.

Specialties: Advanced design techniques, mapping tools
Blog: DataBlick
Anya is a design guru. As the director of DataBlick, she provides visualization and analytics consulting to a wide range of businesses, and blogs passionately about design and communication. At TC15, she emceed the Data + Women meetup, which drew hundreds of attendees from all over the data world.

Specialties: Quantified-self data, community building
Blog: Wannabe Awesome Me
Emily co-hosts the Tableau Wanna Be Podcast, fosters the DC Data + Women Meetup, and founded the Tableau Fringe Festival. Passionate about multidisciplinary work and community involvement, Emily is always happy to help you find that one community resource that will fully address your data needs.

Specialties: Server administration, advanced calculations, development tools
Blog: Tableau Zen
Mark has been fascinated by technology from an early age. He taught himself to program at the age of 15, and his passion for coding soon turned into a love of data. His blog covers a variety of topics, from data scraping to LOD Expressions, to enterprise tips.

Specialties: Data mining, development tools
Blog: Data Plus Science
Jeff often turns data visualization on its head. Together with Andy Kriebel, he created Dear Data Two, a hand-drawn data visualization project inspired by the original Dear Data. Two of his other projects are a voice recognition and response tool for Tableau and a Tableau reference guide that indexes hundreds of community-built resources.

Specialties: Tableau training, sports data
Blog: Data Jedi Ninja
Carl is a data visualization consultant at the Information Lab, and he has a few major passions: basketball, cycling, and teaching Tableau—did we mention basketball? Carl enjoys visualizing basketball data, and he's also starting to dive into quantified-self data.

Specialties: Data architecture, development tools
Blog: Red Headed Step Data
Keith’s blog provides in-depth, easy-to-follow tutorials on a range of technical topics, from R integration to calculations, to how data blending works. Written simply and clearly, his posts address topics relevant to both the business and the enterprise side of analytics.

Specialties: Tableau training, interactivity, advanced calculations
Blog: VizPainter
Joshua is known for building games in Tableau, but his creativity doesn’t end there. His blog is full of tips for building compelling, interactive dashboards, and making sure your visualization is communicating effectively. He’s also a whiz at calcs!

Specialties: Data extraction and transformation, sports data
Blog: Sir Viz-a-Lot
Matt is one of the co-founders of the Reviz Project, which aims to reveal the different data stories contained in a single data set. Matt also loves football. Naturally, these two interests often result in stunning sports visualizations.

Specialties: Tableau deployments, effective design
Blog: TableauFit
Bridget began her career as an ASL interpreter, and then worked in a variety of departments from HR to management, to development. With this multidisciplinary background, she enjoys helping people get the resources they need for a wide range of questions. She is especially passionate about data accessibility and effective storytelling.

Specialties: Data storytelling, open data, visual design
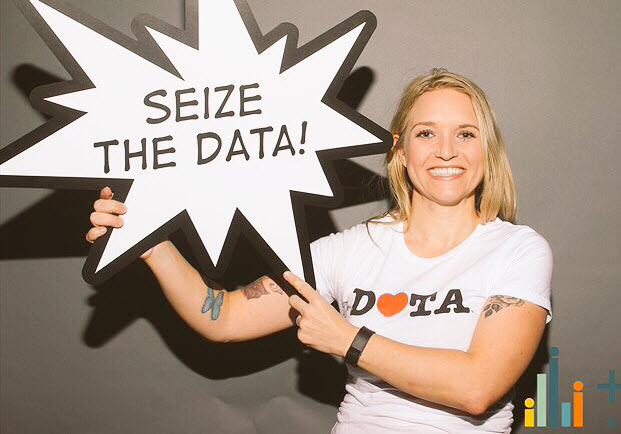
Blog: Data + Brit
Brit is the co-founder of Data Dare, a blog that presents monthly Tableau challenges dedicated to pushing the limits with data. She also enjoys participating in other community-based data visualization projects such as Makeover Monday and Data Chain Mail. Public data and collaborative visualization are just in her blood.

Specialties: Server administration, Tableau deployments
Blog: Paul Banoub's VizNinja Blog
Paul manages the Tableau Center of Excellence at UBS, supporting thousands of users in a global deployment. If you want advice on making your Tableau service fly in a large organization, then he is a great person to reach out to.

Specialties: Advanced visualizations, data architecture, effective design
Blog: Vizible Difference
On his blog, Alexander often shares easy-to-follow tutorials on building advanced charts and calculations. He’s also passionate about design and pays a lot of attention to the little details that make a big difference in a dashboard—like tooltips, headers, symbols, and pictures. And if you’re wondering where the thumbnail for this blog post came from, check out this viz by Alexander!
So what are you waiting for? Introduce yourself to a social ambassador—or three—today.
Related Stories
Subscribe to our blog
Get the latest Tableau updates in your inbox.


