
Tableau 2019.4
Explore the newest features in Tableau 2019.4 including view recommendations, table improvements,
and webhooks support
Feature highlights

View recommendations
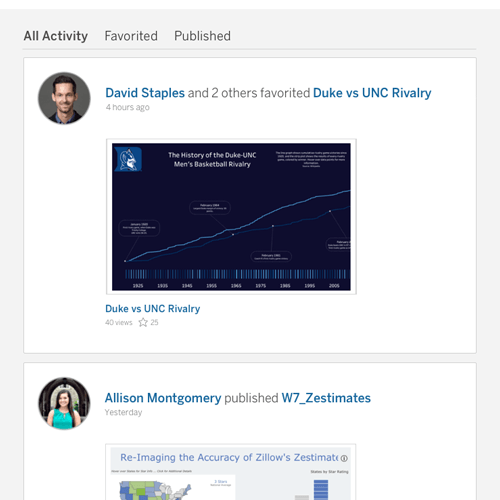
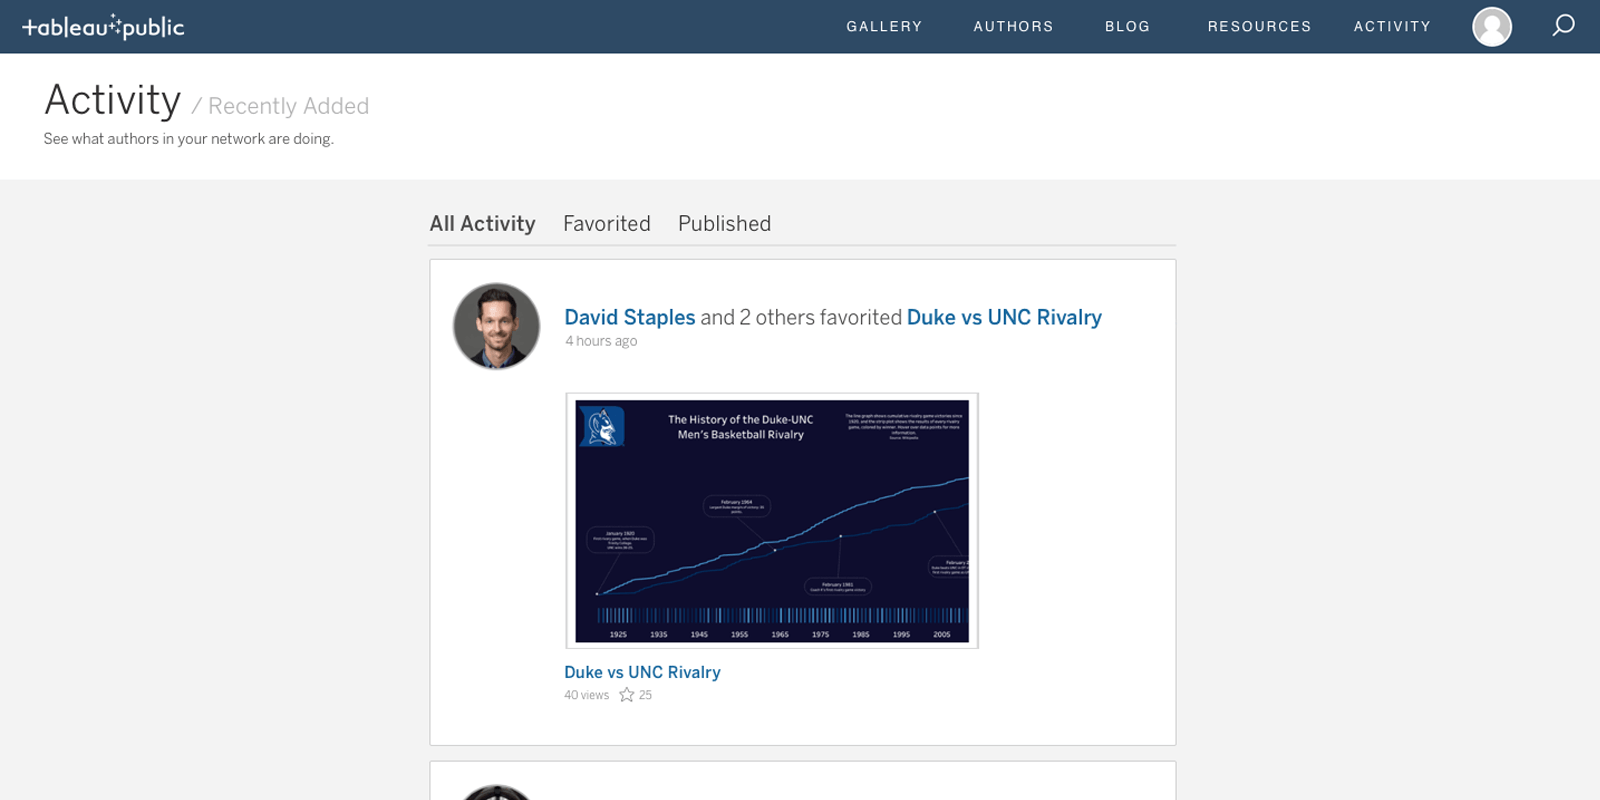
View recommendations are personalized suggestions that instantly connect you to relevant data and content on your site. Powered by machine learning, these recommendations match preferences between users, surfacing content that others like you have found interesting or useful, including what's most popular and recent.

Table improvements
Now you can create tables with up to 50 columns with the ability to scroll horizontally. For flat tables, sort entire columns by dimensions and discrete measures across multiple panes.
Tables are essential to our everyday analysis in Administration and Finance. Now that we can see detail with more than 16 columns and with horizontal scroll, we will be able to understand our tables much better directly in Tableau, without needing to export the data. We are delighted!

Webhooks support
You can now create automated workflows, triggered by events as they happen, with webhooks support for Tableau Cloud and Tableau Server. With webhooks support, the possibilities are endless - you could build workflows that alert users of new content through Slack, or automatically create case tickets within ServiceNow, if an extract fails.
Join the dev program to learn more
Tableau 2019.4 Feature Overview
Tune in for an overview of all the new features included in this release.
Watch nowAll Features


Alibaba Connectors
Now, through a partnership with Alibaba, Tableau customers will be able to natively connect and analyze data in MaxCompute, AnalyticDB, or Data Lake Analytics.
Read more about this partnership
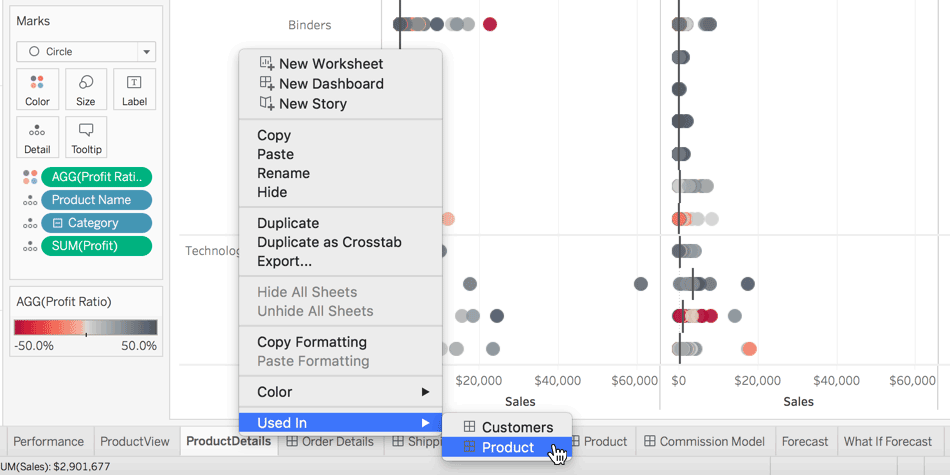


View recommendations
View Recommendations are personalized suggestions that instantly connect you to relevant data and content on your site. Powered by machine learning, these recommendations match preferences between users, surfacing content that others like you have found interesting or useful, including what's most popular and recent.


LinkedIn Sales Navigator connector
Gain deeper insights from your Sales Navigator Application Platform (SNAP) data. Connect to and analyze your SNAP data in Tableau, enabling your Sales Operations users to merge, analyze, and visualize social selling data alongside their other sales performance reports.


Ask Data improvements
We’re making it easier for you to enable more curated experiences for Ask Data. Admins now have the flexibility to enable or disable Ask Data as the default site setting, helping ensure users are only using Ask Data on a subset of curated data sources. Quickly share Ask Data insights with your team by sending a link, without having to save content to the server. And finally, calculating year-over-year metrics is as simple as typing “YoY profit growth”, helping you quickly answer critical questions of your data.


Explain Data improvements
With Tableau 2019.4 Explain Data now supports unvisualized measures and calculated fields, allowing you to inspect your data in more situations.

Webhooks support
Sandboxed extensions
We've made extensions more flexible. Now developers can now create sandboxed extensions, which disables network calls - streamlining the development process from a security standpoint.


Sharing improvements
When sharing a dashboard or view that been modified (through selections, filters, zooming, panning), sharing will automatically generate a link that includes these interactions. Simply enter in the names of any named users on the site to send them an email with the dashboard or view image and an optional note.


