Author dashboards from scratch on the web in Tableau 10
Update: Tableau 10 is here! Download now to try out the feature outlined below.
Tableau 10 includes a new feature that lets you ask additional questions of your data right on the web: web-dashboard authoring!
That means you can create dashboards from scratch on the web, then easily share your work.
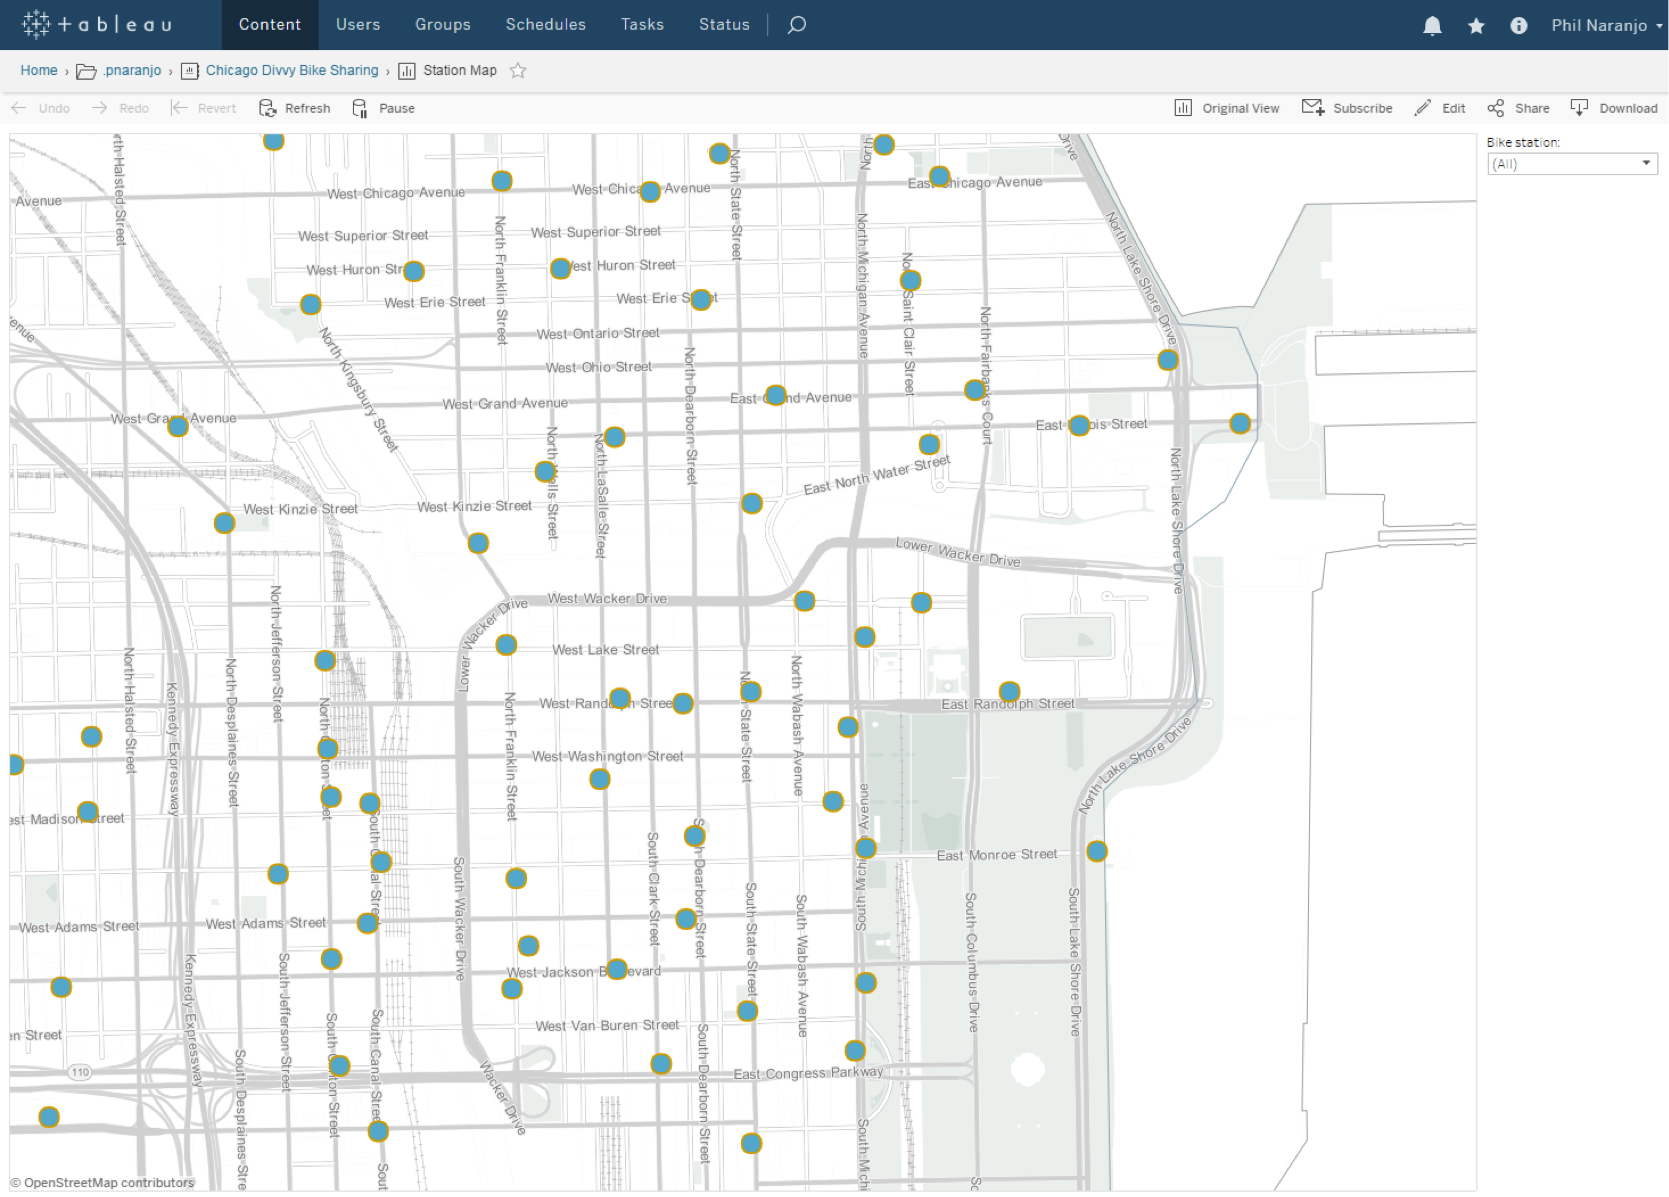
Let me show you how it works. Here’s a workbook published to Tableau Server. It’s about the city of Chicago’s bike-sharing program. (At Tableau, we really love biking.)

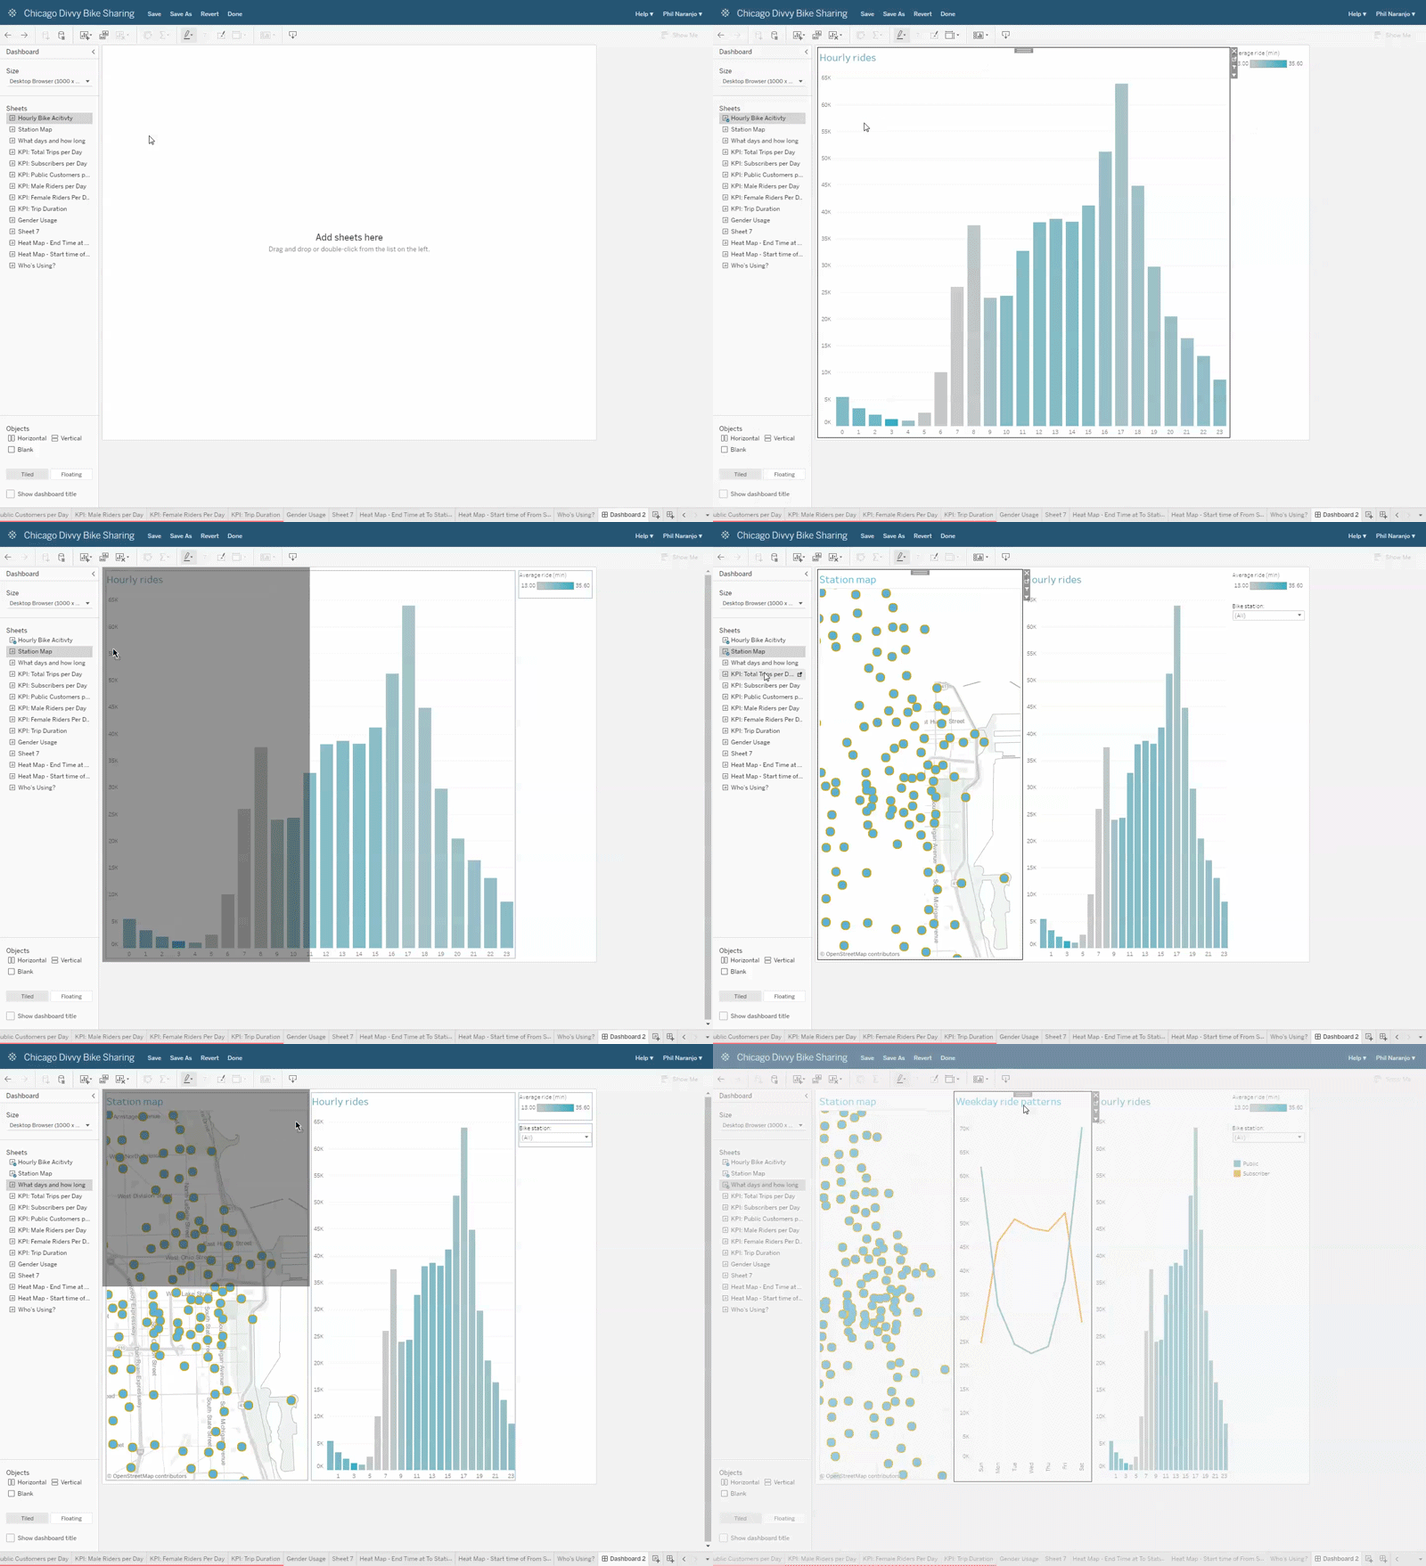
To create a dashboard, click the new-dashboard tab, just as you would in Tableau Desktop.
From the sheet list, drag and drop worksheets to create a dashboard.

As you drag worksheets onto the dashboard, any legends or filters on the worksheets are automatically added to the dashboard.
You can reposition and resize worksheets, just as you would in Tableau Desktop. And using the worksheet context menu, you can add quick filters, parameters, legends, and actions to your dashboard.
With web-dashboard authoring, you can control the publish state of your dashboards and worksheets. And, just as in Tableau Desktop, you can tidy up your dashboard workspace by hiding worksheets that belong to a dashboard.
And you can save your web-authored dashboards and return to them later. Just as with worksheets, you also have the option of downloading and opening your web dashboards in Tableau Desktop.
Join the beta
We’re thrilled to bring you these new features, and we’d love your input. We have a timeline for getting Tableau 10 out the door, but we’d first like to get solid usage in beta and fix any bugs. Please join the beta program and let us know what you think.
Learn more about Tableau 10
Tableau 10 includes a brand new look and feel, and a host of new features to help you prep, analyze, and share your insights even faster. Check out our Coming Soon page for details.
- Uncover patterns in your data with Tableau 10’s clustering feature
- Quickly find marks in context with Tableau 10's new highlighter
- Build your own custom territories in Tableau 10
- Do more with bar charts in Tableau 10
- Tableau 10 includes more maps data, multilingual auto detection
Answers through analytics
- Integrate your data with cross-database joins in Tableau 10
- As requested, you can filter across data sources in Tableau 10
- Do more with APIs in Tableau 10
- Tableau 10 includes even more data-source options
- Connect directly to Google Sheets in Tableau 10
- (Finally!) see and understand your IoT data with our Google Sheets connector
- Connect directly to your QuickBooks online data in Tableau 10
- Favorite your data sources in Tableau 10
- Tableau 10 includes even more data-source options
Data breakthroughs
- Check out the beautiful look and feel of Tableau 10
- Format your workbook with just a few clicks in Tableau 10
- How we designed the new color palettes
- Tableau 10 includes a new typeface designed for data
Beautiful by design
- Design dashboards that shine on any device in Tableau 10
- Tips for designing device-specific dashboards that make everyone happy
- Manage your Tableau Mobile deployment with AirWatch or MobileIron
Delightfully mobile
- Do more while publishing workbooks in Tableau 10
- See a history of your revisions in Tableau 10
- What's new in Tableau Online
Do more on the web
相关故事
Subscribe to our blog
在您的收件箱中获取最新的 Tableau 更新。


