
Interact with public vizzes from around the world
Tableau Public is a free platform to explore, create, and publicly share data visualizations online.

Cycling Vizzes on Tableau Public
What better way to dive into a topic you love, than by looking at the stats?
Get inspired by these cycling data visualizations and learn a bit about the history, participants, and more.
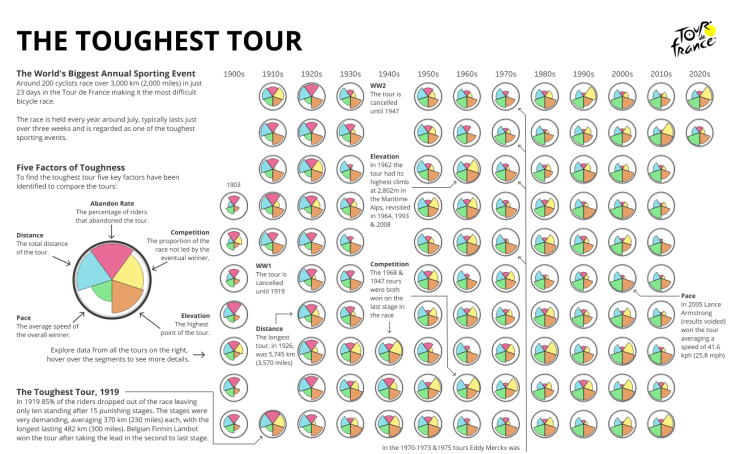
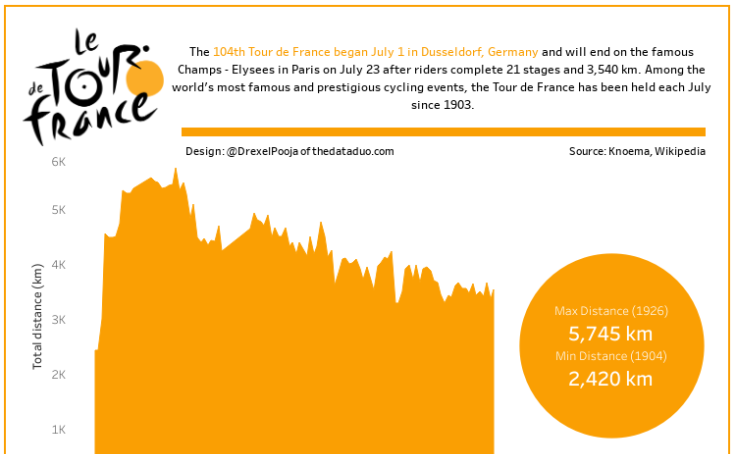
The Toughest Tour | Tour de France

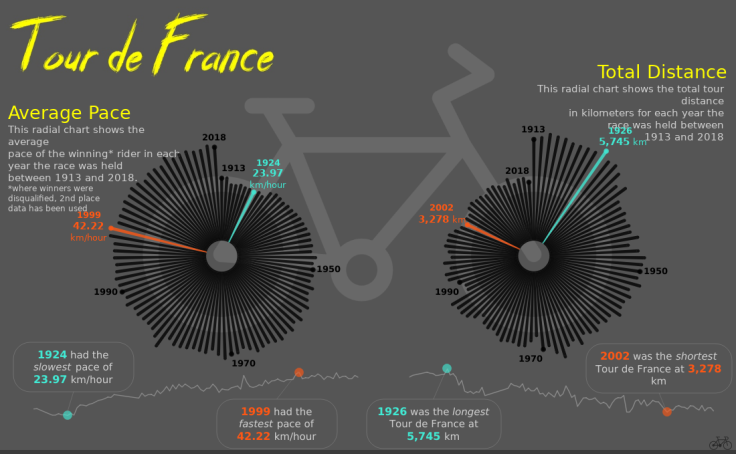
Tour de France (1913-2018)
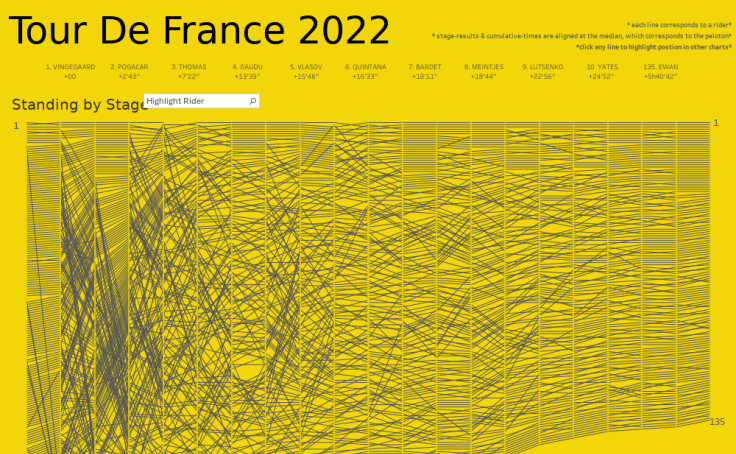
Tour De France 2022
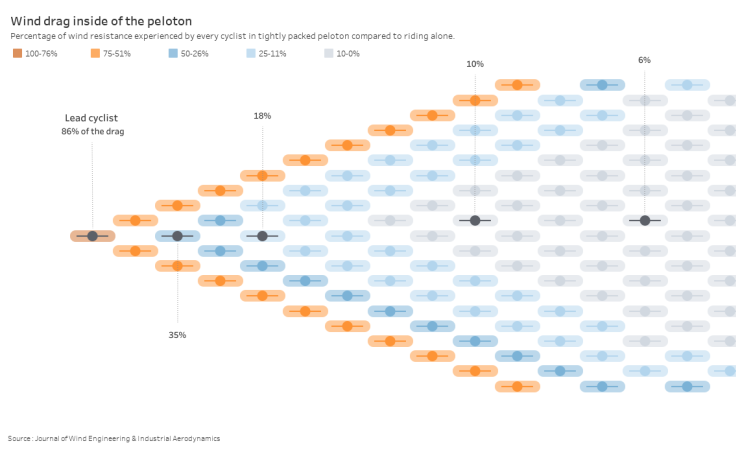
Wind drag in a peleton

My Bicycle History
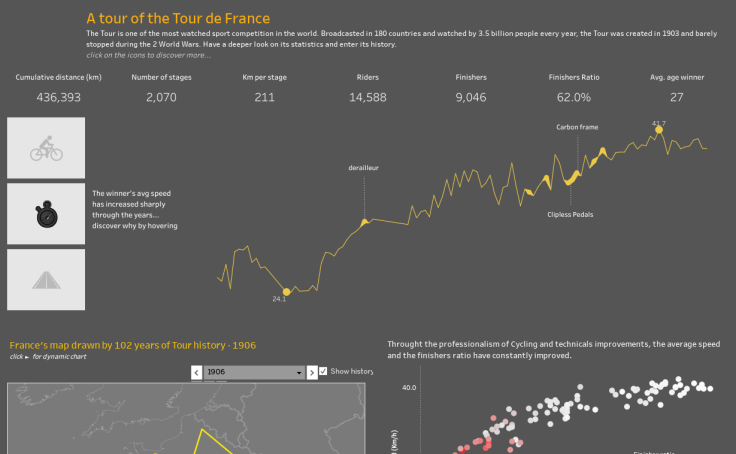
Le Tour de France

My 2023 Peloton Fitness Tracker
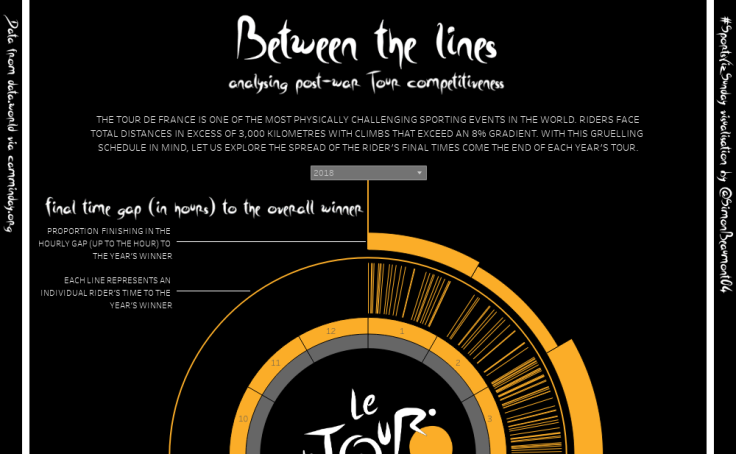
SportsVizSunday Le Tour De France - Between The Lines
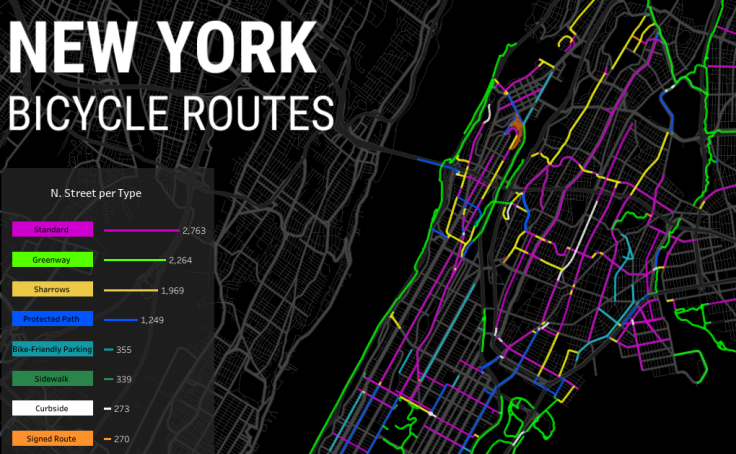
NY- Bicycle Routes
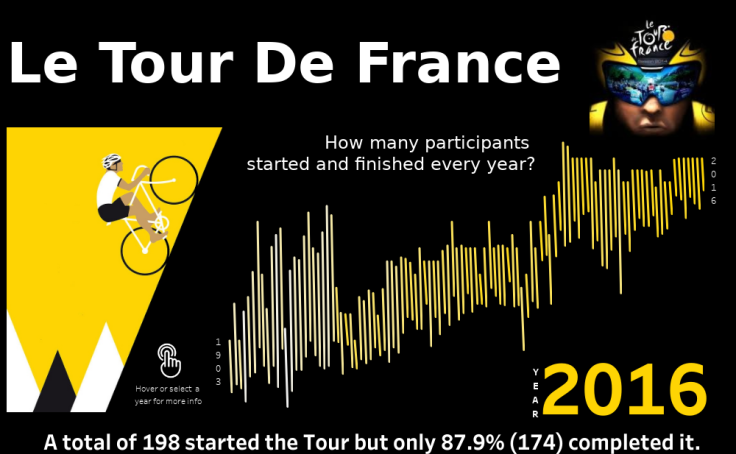
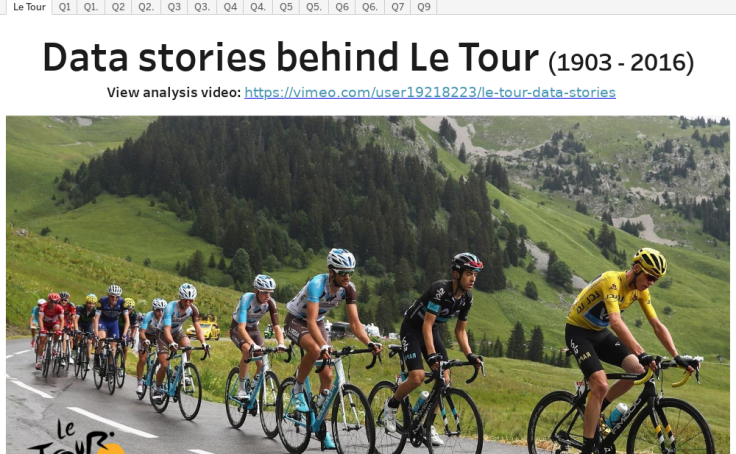
Le Tour de France (1903-2016)

Journey on 2 Wheels
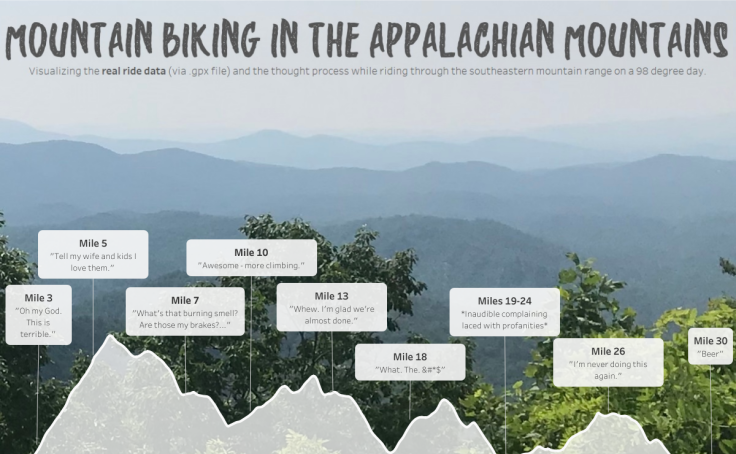
Mountain Biking Appalachia
Tour de France History
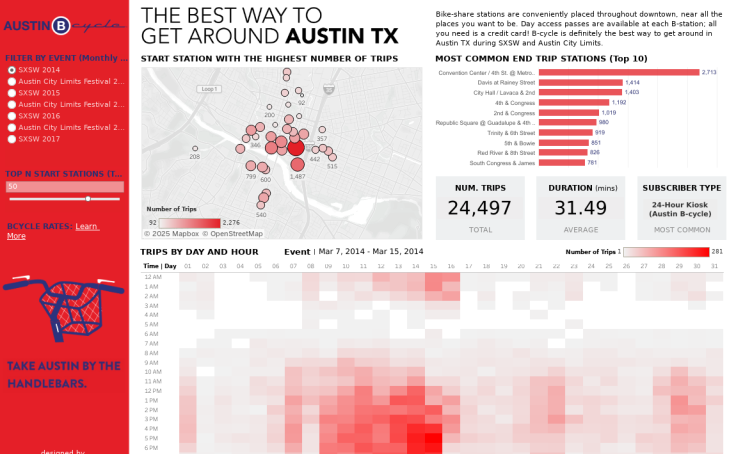
Austin Bike Share
Tour de France

Bicycle Boom of 2020
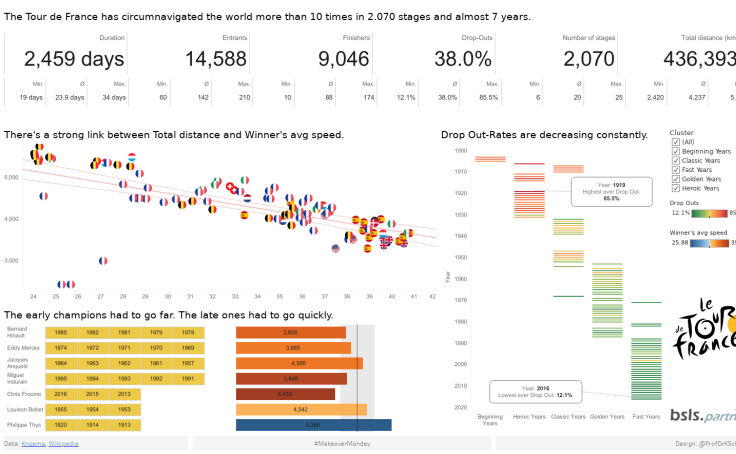
Le Tour de France (1903-2016)
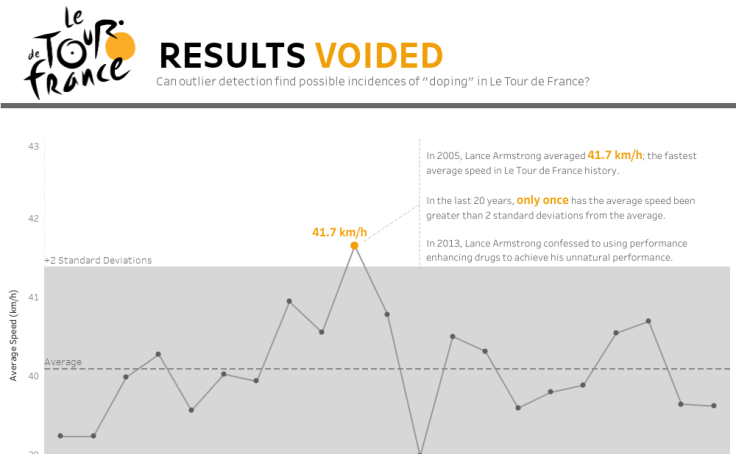
Results Voided-Le Tour De France Outliers
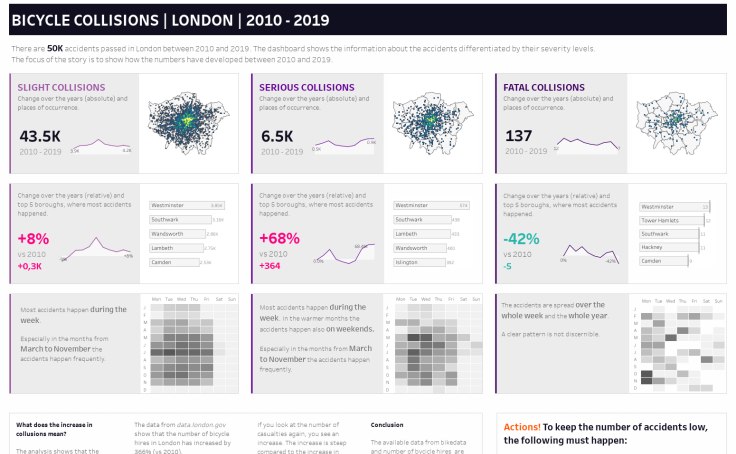
Bicycle Collisions in London
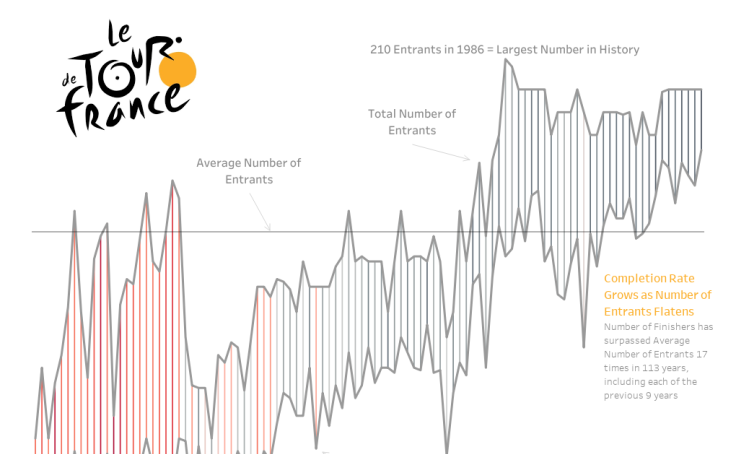
Le Tour de France

Sports Viz Sunday
Visualizing data on a topic you're passionate about is a great way to improve your data skills and up your game. Sports Viz Sunday is a community-led Tableau Project that provides a platform for those interested in sports to come together and explore the world of sports data and visualization. Create and share data visualizations using rich, sports-themed data sets in this monthly Tableau community challenge.
Learn moreConnect with the DataFam
Follow @TableauPublic on Twitter and tag us when you’ve got something to share.