Perform advanced spatial analysis with spatial join—now available in Tableau
When analyzing location data, you often need to handle data that falls inside a given boundary. However, location data is regularly captured and stored in different formats as point data and polygon data, which means that you have to join these files in order to analyze them.
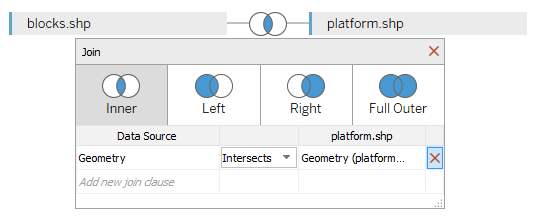
We recently announced spatial joins, a new join type in the newest Tableau release (2018.2). Spatial joins allow you to join points and polygons from two spatial tables based on their location. So you can connect your point data to polygons and visualize that data on a map.
Spatially aggregate your data without leaving Tableau
Leverage any supported spatial data source, including Esri Shapefiles, KML, GeoJSON, MapInfo Tables, Tableau Extracts, and SQL Server. Now, instead of using an additional tool, you can spatially aggregate data without ever leaving Tableau.
The magic behind spatial join is a new join predicate called "Intersects." Intersects match the locations of points from a geographic data table to polygons from another data table. Tableau will join data together when a point lies inside a polygon.

Spatial joins for real-world scenarios
Location data is everywhere—in all industries and fields of study. And spatial joins support exploration and analysis in a variety of different scenarios.
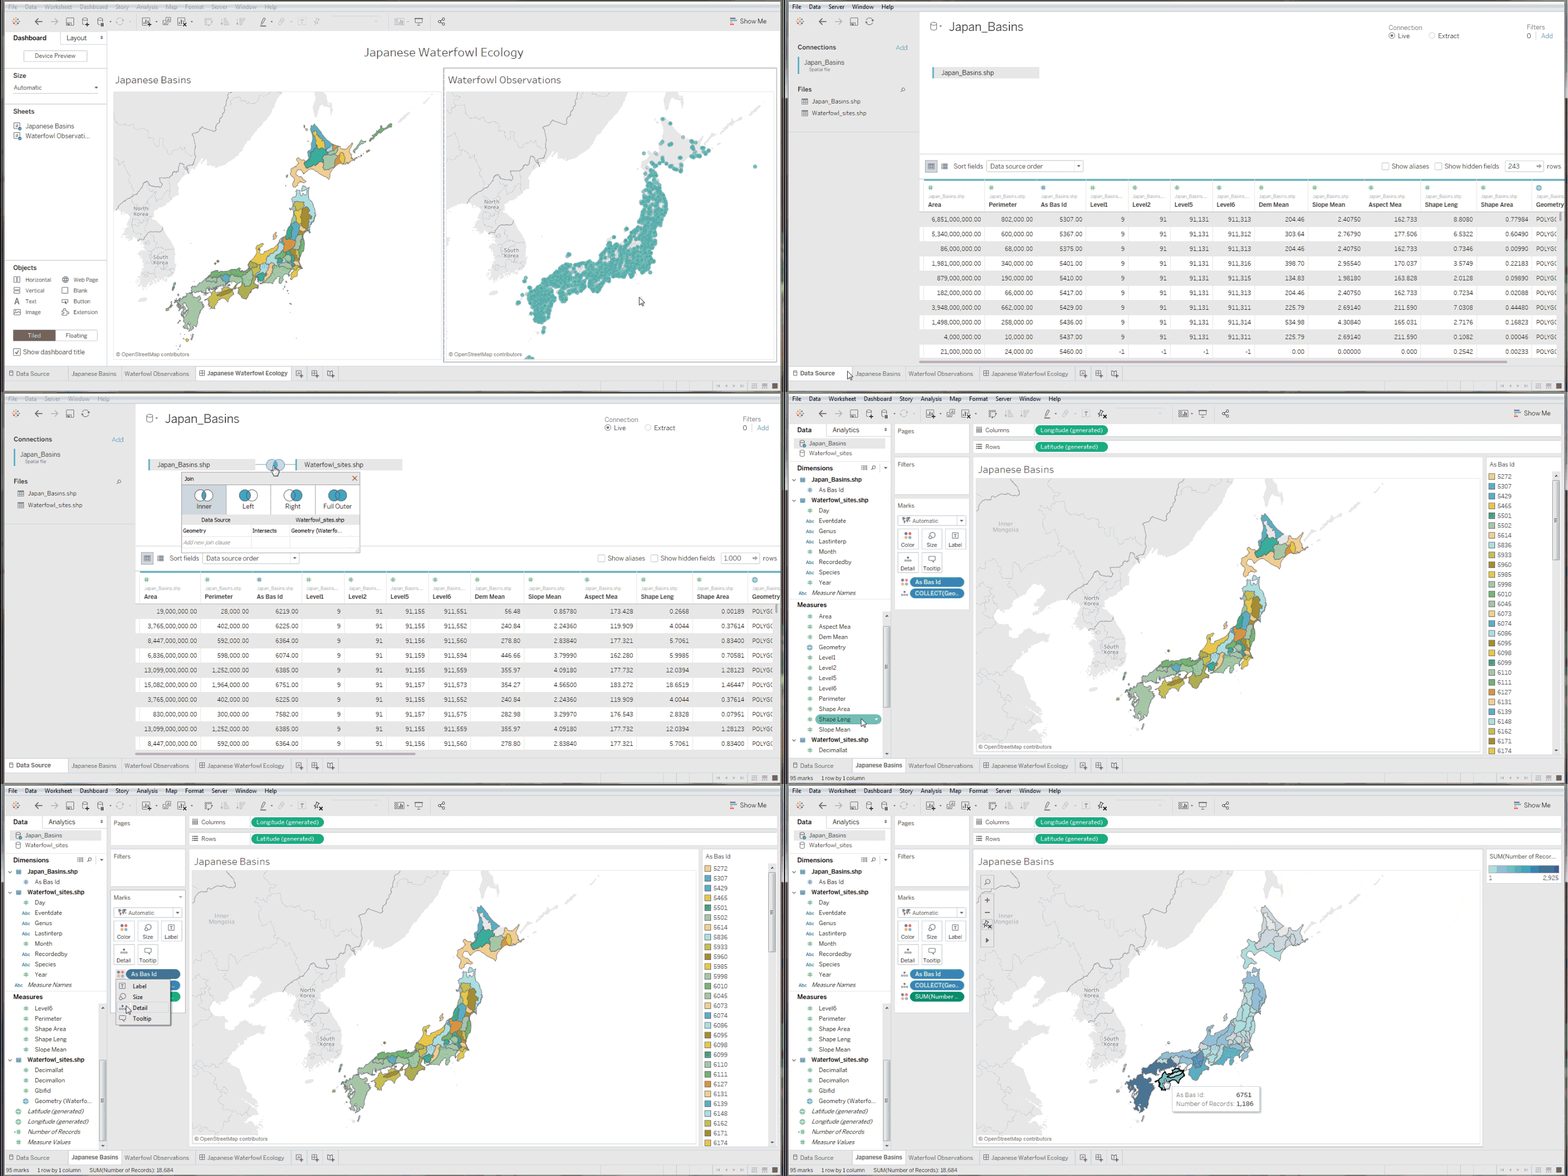
For example, let's say you work with communities to analyze waterfowl sightings in watershed basin areas. You want to know how many birds have been spotted in each individual watershed. You have polygon data outlining locations of watershed basins and point data that records waterfowl sightings.
What if there's no shared fields between the data sets, but you know that they are both spatial files? You know the geographic outlines for the basins and the geographic information for each bird sighting.
With spatial join, you could join location data from bird observations with watershed boundaries to find your answer and analyze further.

With spatial join, you can use a map to analyze the amount of bird observations within each boundary.
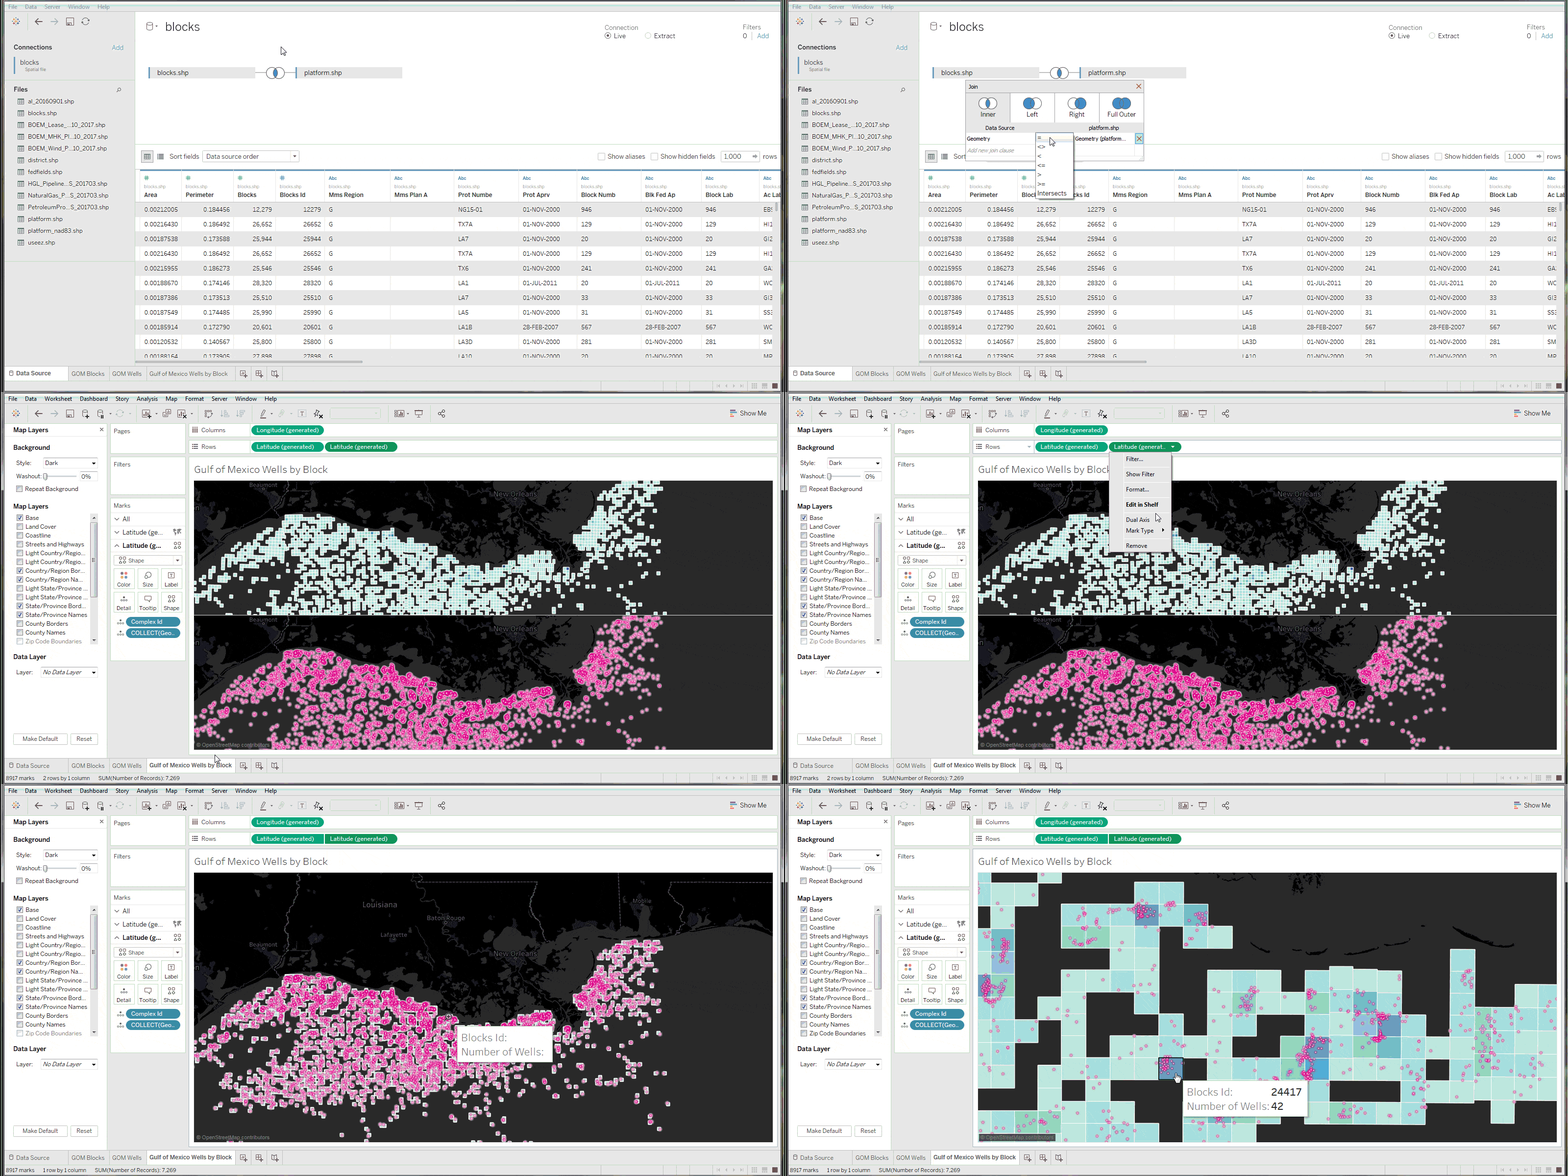
You could also use spatial joins for scenarios like tracking offshore wells by count or production or analyzing road segments according to number of traffic incidents. Spatial join provides endless opportunities to find the where in your data.
Take your results one step further and leverage Tableau’s dual-axis functionality to layer the two datasets on the map. A layered map can combine the aggregated data with the discrete points, providing detailed context for exploration.

Layer two spatial data sets on a map with Tableau's dual-axis functionality.
Spatial join empowers you to conduct advanced spatial analysis in Tableau instead of having to rely on outside mapping applications.
Load spatial data, join spatial data, and visualize the results—all without leaving Tableau. The sky is the limit—it's just up to you to explore.
Get started with the newest version of Tableau
Download the newest Tableau release (2018.2) to take advantage of spatial joins.
We’d like to extend a huge thank you to the 16,000 beta testers who tried the Tableau 2018.2 beta. Your time and energy has made this release one of our best yet. If you’d like to be involved in future beta programs, sign up today. Happy mapping!
Relaterade berättelser
Subscribe to our blog
Få de senaste Tableau-uppdateringarna i din inbox.


