Iron Viz tackles geospatial data in best of the Tableau web

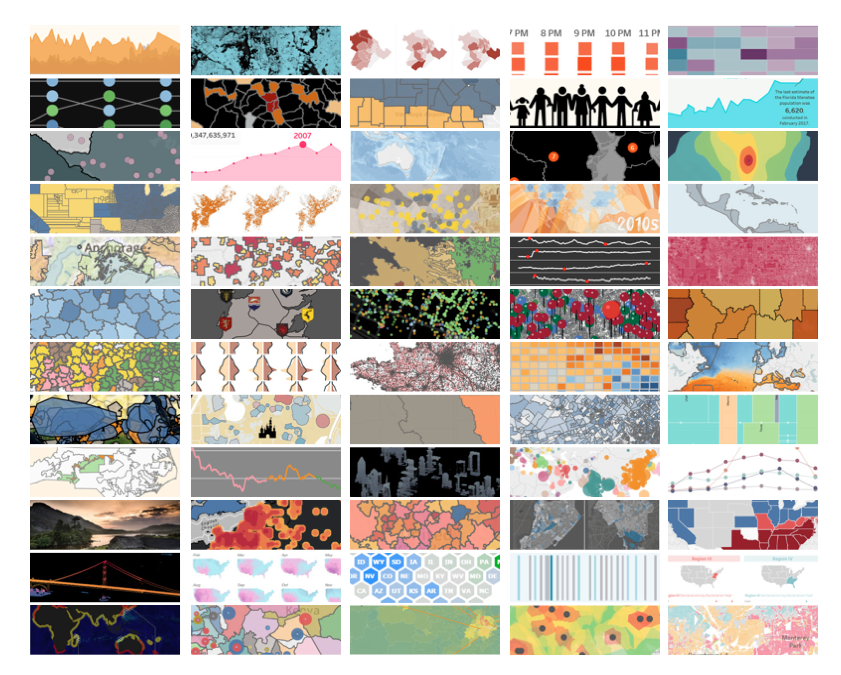
It’s that time of year again! We've begun the hunt for our next Iron Viz champion. The first Feeder Contest was all about geospatial data, and our community did not disappoint. We were blown away by the creative, analytically rich entries.
If you haven’t checked them out, take a few minutes to explore all the entries—and be sure to vote for your favorites!
And here is the rest of the best of the Tableau web.
Tips and tricks
The Information Lab Relationship of Command Buttons: why Tableau tooltips lose functionality
Drawing with Numbers Multiple Ways to Multi-Select and Highlight in Tableau
Inviso Labels on stacked bar chart
Ryan Sleeper Practical Tableau: How to Create Icon-Based Navigation or Filters
The Marks Card How To: An Alternative to Viz in Tooltips
Twitter: Emily Kund Replacing References
Data School Documenting your Tableau Workbook
Visual design
VizWiz Makeover Monday: The Secret of Success
Storytelling with data so what?
Pixel Mixer Anatomy of a Viz
Data Revelations Dr. Strangechart
Inspiration
Interworks Defending Desktop I: 5 Reasons Why Every Tableau User Should Take 'Fundamentals'
VizPainter Storytelling with Data Visualization
CIO How IT Can Empower the Enterprise with Self-Service Analytics at Scale
Beyond the basics
The Last Data Bender Beyond Shape Files…
Visible Difference Correlation Calculations in Tableau
DataBlick Building towards d3.js "plugins" for Tableau
bfongdata Custom Tableau Server Repository Dashboards
Datalert Finally a Slack integration for Tableau
Bonus!
VizWiz Tableau Tip Tuesday: Table Calculations Overview
Relaterade berättelser
Subscribe to our blog
Få de senaste Tableau-uppdateringarna i din inbox.


