How Tableau Pulse Approaches NLP with Q&A to Empower Everyone


Artificial intelligence (AI) is the most revolutionary technology of our lifetime, but it can be challenging for individuals and businesses to know how to get value from AI and data. You get the most value from data from the insights revealed—or more specifically, getting the right insights with the right business context to the people who need them for sound business decisions. Making this happen for our customers is at the heart of why we built Tableau Pulse.
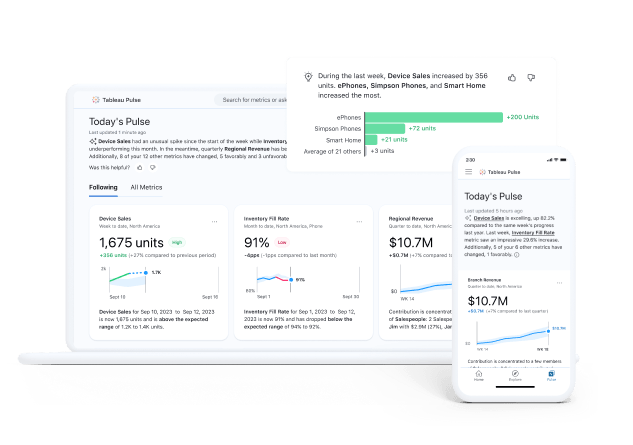
Tableau Pulse, as the latest innovation of Tableau AI, transforms the way people interact with data by delivering AI-powered insights to scale data-driven decision making. The latest enhancements are now available to you with Pulse Q&A. Pulse Q&A now unlocks more ways to explore your insights through guided questions and through the ability to ask questions. An additional "Ask" button next to the existing guided questions enables you to ask questions related to metrics you are investigating.
Read on to discover the Pulse Q&A enhancements and understand the approach that makes Tableau Pulse unique.
What makes Tableau Pulse different?
Tableau Pulse reimagines analytics done for your everyday business people by delivering intelligent, personalized, and contextual insights on the metrics that matter to them. Regardless of your analytics skill level, Tableau Pulse generates and packages insights that answer common questions—without you needing to ask them. It solves the problem of people not knowing what they don’t know and processes findings in natural language—enhanced with AI—and delivers them to users in Tableau Pulse. These insights appear in the form of guided conversations, digests in the flow of work, and text summaries that quickly tell you the changes to focus on before diving deeper. In fact, Pulse already answers business questions before business users even know what they want to explore or what questions to ask.
From an experience perspective, this approach not only answers questions proactively but instills just enough context and intent in business users with little time and attention to really become self-motivated and engage in analytical explorations. By unveiling insights on the metric of their own choice, in their own way, and at their own pace, business users are likely to stay engaged during their explorations. If, at any point, they are done with a particular metric of interest, business users can always arrive at a new view of exploration (same metric definition) by adjusting the time or dimensional filters applied on the current metric or navigate to other metric contexts (same or different definition) via metric search that comes with features like autocomplete and global search resolution to existing metrics, removing deadends to users’ exploration journey.
In an average organization today, 70% of people in marketing, sales, and service are still underserved with data. These are the people who would love and need to be making data-informed decisions fast by asking the right set of questions—or more crucially—getting the business insights they need for their jobs, whoever and wherever they are. Instead of attempting to reactively answer bespoke data questions, what if we detected and delivered insights proactively? More specifically, insights that can be used to answer more complex business questions that are commonly asked by business users in an integrated, intuitive, and trusted experience.
What is Pulse Q&A?
Most AI solutions force people to ask questions of their data, which can be a tall order for people who don't necessarily know what questions to ask. Pulse Q&A leverages metrics and insights, as a proactive business Q&A engine that gets users closer to their answers when they need them. Proactive answering begins before the user asks a question and helps surface business insights on demand. This feature builds on top of the existing Guided Q&A experience to unlock and encourage more ways of business user exploration of their insights.
Pulse Q&A with its latest addition of the “Ask” button can further enhance and accelerate business users’ time to insight. Using the "Ask" feature will prompt suggested questions that match the insights you are investigating.
Business users just want to get to their answers fast—which often come in the form of a metric. A simple example would be “revenue”, which could be modeled with a structured query such as “sum of sales over order date” on a select data source but would usually require many manual steps such as synonym curation to enable query accuracy. A more complex example could be “conversion rate”, which is simply unavailable by aggregating any immediate columns and might involve intermediary calculations that can create inconsistencies across interpretations. Moreover, questions that dashboards generally try to answer, such as a dimensional breakdown of a value or even a delta, are simply extended analyses of a metric over a select time frame or across all time.
How does Pulse Q&A work?
To understand how Pulse Q&A works in reality, we have to start from the basics. Conventional Q&A systems in BI tools require business users to query over tabular data sets that might not be business-ready and focus on giving non-analyst business users direct exposure to the data, interactions, and processes that they might not be familiar with, to explore using trial and error with declarative steps of nomination and calculation on their own. This usually involves leveraging heuristical parsers, pre-runtime indexing, fuzzy matching, concept representations, hidden commands, alongside other curation-heavy semantic ontologies or (de)compositional logics to pull off a black-box feature that works occasionally.
The answer was clear. Instead of having users to pick and choose the right data sets to query from, learning to use the system and metadata behind, think of and type in a well-crafted query in slight variations every single time, Pulse takes these problems away by positioning metrics as a first-class citizen that can be defined once by the analysts from any data source, filterable to various usage contexts, and consumed by business users in their personalized workflows.
These metrics not only capture an organization’s business logics and contexts in a trusted, single source of truth but also allow business users to search, filter to their own preference, follow or share with others—all in one place. With metric definitions and any applicable time or dimensional filters as the foundation, Tableau Pulse then automates the most frequently asked business questions on the metric context, such as drivers, contributors, trends, and changes, perform these analyses with deterministic calculations, and deliver them in the form of highly digestible natural language insights that could be uncovered in guided conversations via either point-and-click (guided questions) or typing in (“Ask”). Now, let’s take a closer look at each of these capabilities.
Guided questions
On the insight exploration page of a metric, users can see up to three, top, guided questions recommended for them already before they know to ask. Because insights are relevant to the metrics users are interested to explore, which are ranked and improved over time based on their unique impact scores among other usage signals, these representing questions are ordered in a way that is highly relevant to what users want to see. The guided questions are phrased in a colloquial manner with the business context in mind that best predict and cater to what everyday users expect to ask based on the underlying metric and data. Altogether, they lift the burden of business users knowing what to ask, brainstorming how to ask, needing to type them in, experimenting with the system iteratively and worrying about whether they can trust the answers based on how they pick, filter, and interpret the data. With one-to-one, question-to-insight mapping, users can reveal these insights progressively and at their own pace of consumption to find themselves receiving rich, bite-size textual explanations alongside complementing, best-practice visuals that enhance their understanding of the facts discussed. More importantly, the context of the conversation is persisted during a page load, meaning business users no longer have to worry about backtracking in their browser to revisit what they have already seen.
“Ask”
Aside from the ability to select from just those top-recommended guided questions to explore, users can now see an additional “Ask” button upfront, which allows them to launch a Q&A popover and type their own question in plain, natural language to receive ranked, semantic matches of insights detected on the same metric they are investigating. Here, instead of calling a large language model (LLM) that would add more latency or risks of hallucination to the response, Pulse Q&A leverages a fast-inferencing embeddings model - a building block to modern LLMs, learned, and capable of understanding general human language—to compute vectors of the guided questions and their underlying insights to be compared against those of the user-submitted queries using best tried algorithms.
The query results are always multiple and surfaced to users in a rank order based on the semantic similarities, displaying a selection of question/insight candidates to explore that best map to their intent while leaving the floor open for further discoveries. Selecting the guided question surfaced this way will yield the same insight response as if the user clicks through it outside the popover, and users can always come back and follow up with more questions relevant to the metric they are exploring. This new way of exploration adds another dimension to the depth of experience users can engage in when understanding their metrics and getting the answers they need from our insights. Soon, we’ll support additional capabilities that enhance this point of entry to help users navigate to more accurate metric views they need to see.
How NLP is used for Tableau Pulse Q&A
Conversational analytics, data storytelling, semantic search. These are all examples in a long line of applications of Natural Language Processing (NLP) technologies in analytics that have significantly transformed how we interact with data and information over the years. From the early days of NLP, we have seen a natural bifurcation of the technology into two general sets of applications: Natural Language Generation (NLG) and Natural Language Query (NLQ). Unlike a conventional Q&A system, where NLQ itself is the main product, Pulse leverages a variety of NLG and NLQ technologies powered by various forms of AI and algorithms simply as a vehicle to deliver relevant business insights to the end users at the speed of thought—after all, Natural Language Generation (NLG) and Natural Language Query (NLQ) are merely two sides of the same coin.
Both NLG and NLQ have their own appeal: the magic of getting some forms of data answers in and from natural language has consistently captivated analysts and analytic consumers alike. Tableau has a history of building both types of solutions. From building Ask Data as a curation-first NLQ solution that creates Tableau visualizations from a data source to releasing Data Stories and Explain Data as standalone NLG solutions to narrate data insights on pre-built dashboards. Through these innovations, we’ve gained some valuable lessons for integrating AI into analytics: Most importantly, we need to solve the right problem with the right union of tools for the right group of people, which led us to develop Tableau Pulse.
Instead of having to passively react to user queries with no guarantees of answer accuracy only as they come in, Tableau Pulse can automate the process of insight detection and delivery by anticipating analytical needs and bridging what the system detects and what business users want where and when they need them. Since metrics are already defined by analysts, no additional curation overhead or mental provenance is needed on the business users to enable the experience other than going into Pulse and start consuming.
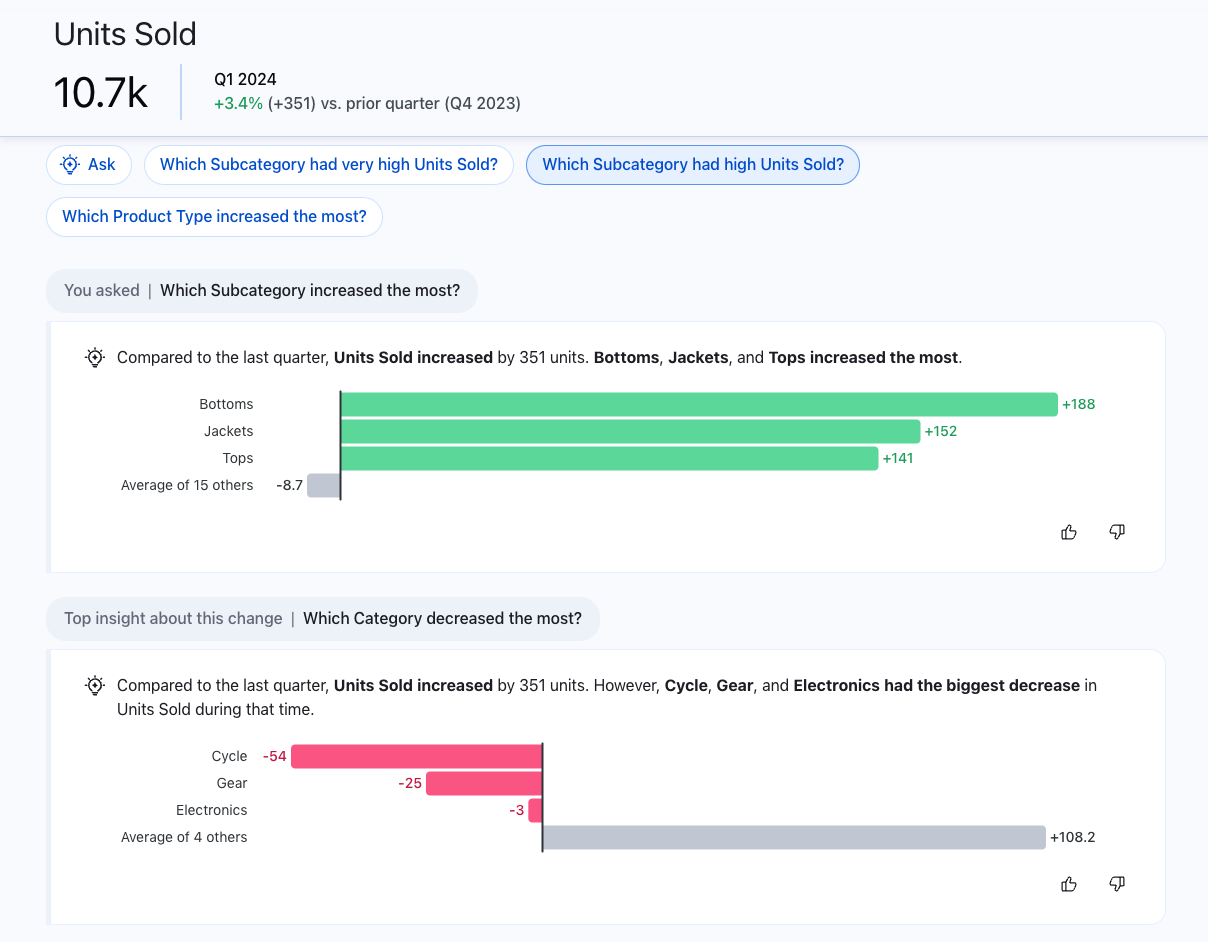
And with metrics and insights always calculated live and delivered fresh to users as they explore in Pulse, business questions like “What products sold well?”, “Which categories rose?”, or “Tell me about the trend in profit” could all be answered via Q&A in these intuitive modes of insight exploration, enabling real-time intelligence to drive real-time actions via natural language interactions that are simple, engaging, and rewarding.
What’s next for Q&A?
As we continue to invest in the insights platform, Tableau Pulse will not only be able to reason over descriptive questions of what happened, but over time, the diagnostic of why it happened, and the predictive of what will happen next. Eventually, Pulse can prescribe questions of what you should do in natural language explorations, stretching the limits of what a truly intelligent BI can and should answer. The best part is, Pulse Q&A as it stands today, is generally available out-of-the-box in both mobile and web experiences to all customers who enable Tableau Pulse on their site. This is only the start to a long run of innovations we have moving forward.
Not only do we intend to iterate on the Pulse natural language experience for business users by unlocking more seamless explorations, but we also wish to extend our conversational capabilities to serve analysts in their existing workflows with tools like Einstein Copilot for Tableau. What isn’t and won’t change is Tableau’s continued determination to serve all users of analytics so that they can do their jobs better and faster, closing the gap between data and people in every organization, and keeping everyone in the loop of insight to action.
Relaterade berättelser

What to Know About Tableau Next: FAQ
 7 April, 2025

Engineering AI for Automated Relationships in Tableau Next

AI-Driven Data Modeling with Tableau Semantics: A Principal Architect’s Perspective
Subscribe to our blog
Få de senaste Tableau-uppdateringarna i din inbox.