DataFam Roundup: September 27 - October 1, 2021
Dig into the latest DataFam Roundup—a weekly blog that brings together community content all in one post. As always, we invite you to send us your content—and the DataFam content from your peers that have inspired you! Find the content submission form here.
DataFam content
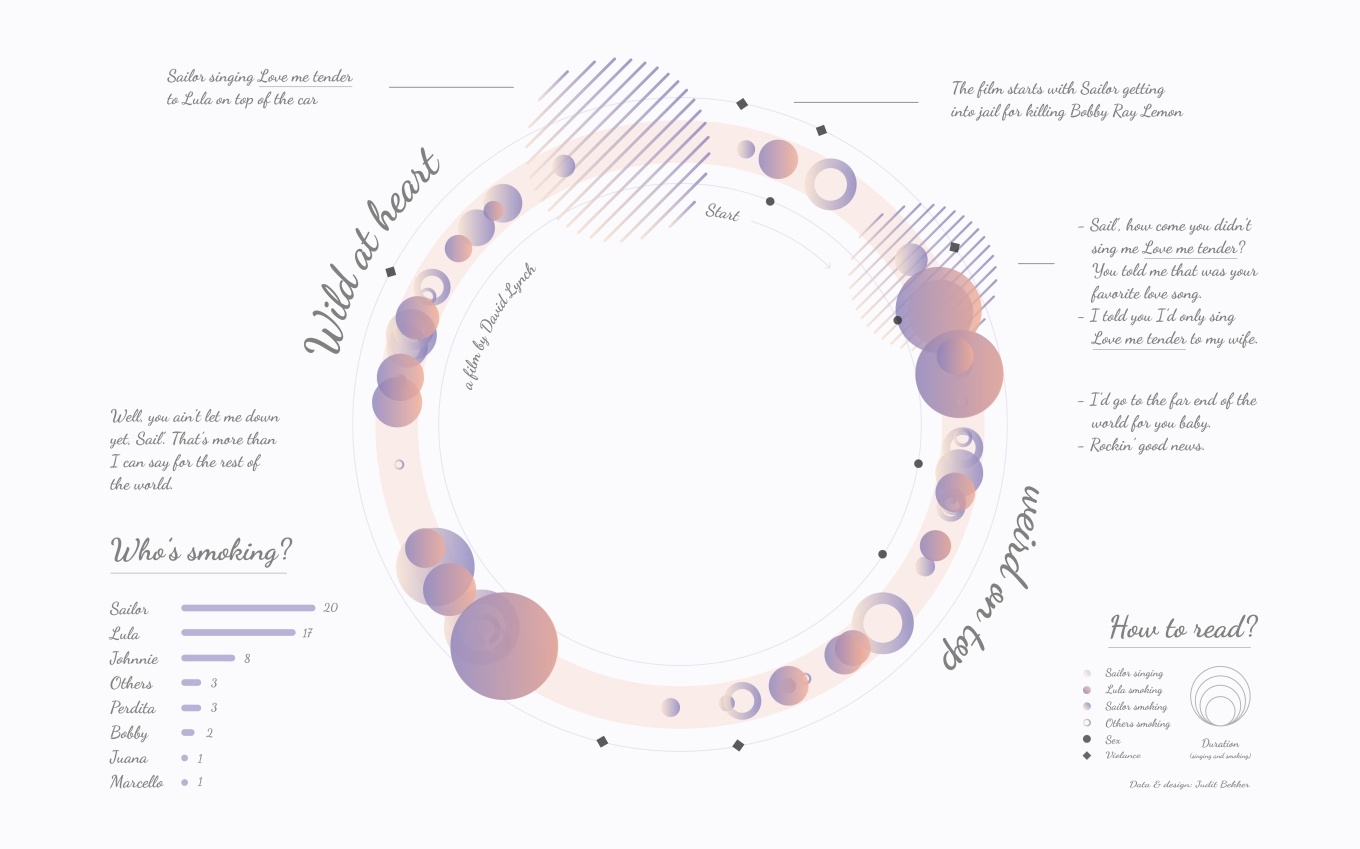
Judit Bekker, Data Muggle: How to make a Saturn chart?
Dive into content created by the Tableau Community:
- Adam Mico, Towards Data Science: Overcoming Data Visualization Imposter Syndrome
- Alan Murray, Tableau Academy: Tabl....Noooooo!
- Jonathan Drummey and Keith Helfrich, The Sensemaker's Video Podcast: Exploring the Differences Between Joins, Blends, and Relationships
- Donabel Santos, sqlbelle: Getting to know Tableau Desktop Workspace / Interface / Canvas
- Judit Bekker, Data Muggle: How to make a Saturn chart?
- Brandi Beals: 10 Creative Ways to Use Tags in Tableau
- Marc Reid: datavis.blog: Dashboard Productivity Tips
- Nicole Lillian Mark, SELECT * FROM data;: Dataviz Roundup 03
- Yupeng Wu: 业务5:从问题到图形分析-某消费金融的数据分析-上 Business 5: From problem to graphic analysis-data analysis of a certain consumer finance-on (Chinese)
- Claire Zhang: Parameters and Dynamic Date Level Calculations in Tableau
-
Yamil Medina, Aaron Simmons, Kiefer Persaud & Luis Rivera, Data Meaning: 3@3 Live: A Mystery Chart Show
-
Agata Mężyńska and Mateusz Karmalski, Scatterplot – tajniki (Polish)
Upcoming events and community participation
Tableau Conference Register Today!
- Tableau Conference: Join Tableau and the world's largest data community online for three days of learning, connection, and inspiration. Register Today!
- Iron Viz, the world’s largest virtual data visualization competition—ignites and showcases the power of the Tableau Community, giving you the opportunity to interact with data rockstars worldwide. Three finalists will advance to the 2021 Iron Viz Championship this November at Tableau Conferece.
- Virtual Data Careers Fair (UK and Europe) - October 6th at 9 a.m. BST: Curious about what a career in data looks like? Tableau Academic Programs is hosting its first ever virtual Data Careers Fair, providing students, graduates, and job seekers with direct access to recruiters from some of our top customers - representing a wide range of employers, all with openings in the data and analytics space.
- #Viz4Climate Action Viz Challenge - Participate by October 10th! #TheSDGVizProject is thrilled to team up with Tableau for the #Viz4ClimateChange challenge leading up to the #COP26 UN Climate Conference. Submit your climate related vizzes by October 10th for a chance to win one of three $100 gift cards to the Tableau Store, and to be featured on Tableau Public! Vizzes will be judged by Andy Cotgreave (Tableau) and Clayton Aldern, data journalist at Grist. Click the link for challenge guidelines.
- Data Book Club with Brandi Beals: This fall we'll be reading The Adaptation Advantage by Heather McGowan and Chris Shipley. While not specifically about data, the book will get us to think outside the box and challenge our approach to data. The first virtual discussion will be held on Tuesday, September 28 at 12pm CT.
- Are you a visualization and storytelling expert? Enter the Data Viz Competition to showcase your data-driven artistic skills while competing for top prizes!
- Data Visualization: State of the Industry 2021: The purpose of this survey is to help the Data Visualization Society and the broader data visualization community understand the state of data visualization, the people who make it, the challenges they face, what can help practitioners, and where the field is headed.
Vizzes
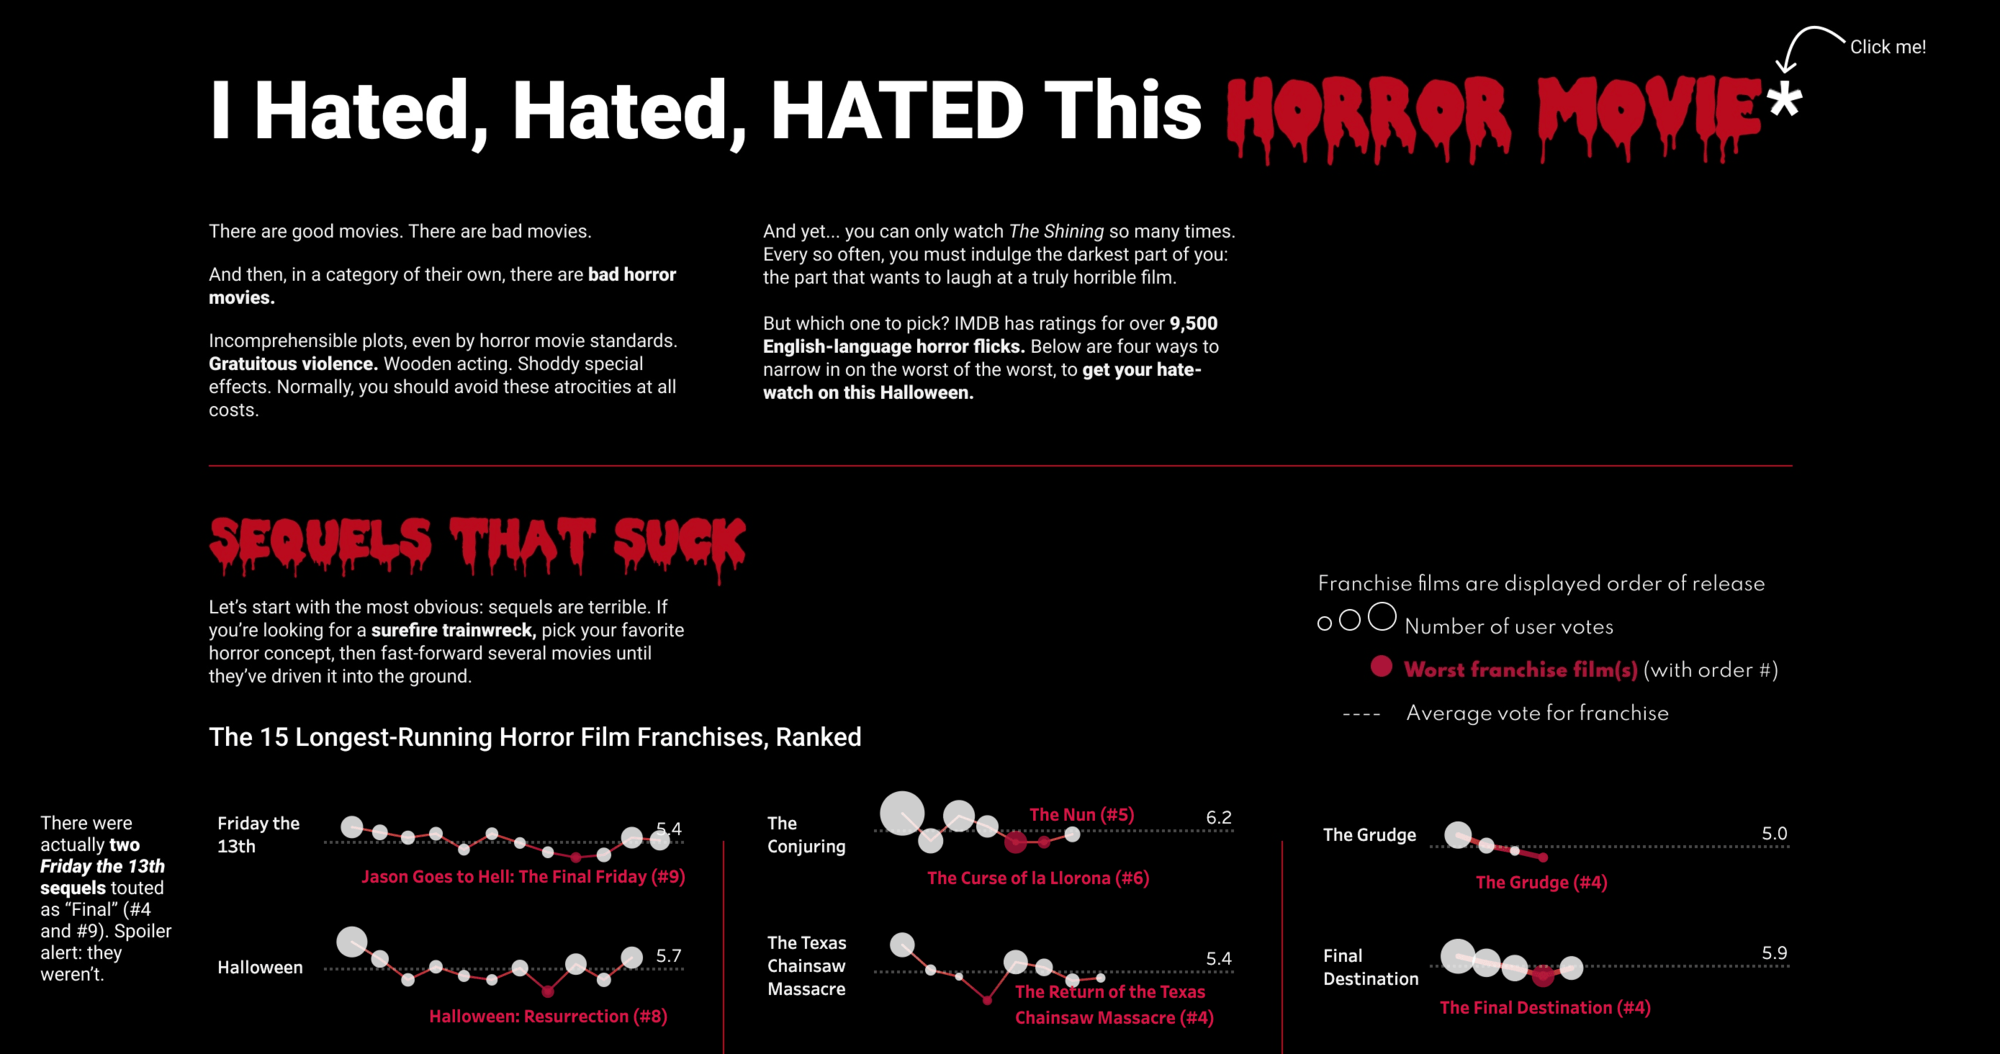
Branden Kornell: I Hated, Hated, HATED This Horror Movie
Catch this week’s Viz of the Days here and subscribe to get them emailed directly to your inbox.
Check out some inspirational vizzes created by the community:
-
Nabilah Rahman: Enabler of Healthy Lifestyle
-
Ken Flerlage: Rating the Presidents
-
Branden Kornell: I Hated, Hated, HATED This Horror Movie
-
Arshad Ejaz: The 20 Largest Solar Power Plants in the World by Capacity
-
Adam Green: 50 Great JAZZ Drummers
-
Luke Abraham: Dark Web Price Index 2021
Community Projects
Makeover Monday
Join the community every Monday to work with a given data set and create better, more effective visualizations.
Web: Makeover Monday
Twitter: #MakeoverMonday
Week 39: Makeover Monday Week 30
Workout Wednesday
Build your skills with a weekly challenge to re-create an interactive data visualization.
Web: Workout Wednesday
Twitter: #WOW2021
Week 38: How Can You Quickly Tell the Net Change Between Two Dates? (Community Challenge)
Sports Viz Sunday
Create and share data visualizations using rich, sports-themed data sets in a monthly challenge.
Web: Sports Viz Sunday
Twitter: #SportsVizSunday
September 2021: Sporting Heroes & Legends
Iron Quest
Practice data sourcing, preparation, and visualization skills in a themed monthly challenge.
Web: Iron Quest
Twitter: #IronQuest
September 2021: Sporting Heroes & Legends
Storytelling with Data
Practice data visualization and storytelling skills by participating in monthly challenges and exercises.
Web: Storytelling with Data
Twitter: #SWDChallenge
October 2021: makeover challenge
Project Health Viz
Uncover new stories by visualizing healthcare data sets provided each month.
Web: Project Health Viz
Twitter: #ProjectHealthViz
September 2021: Biggest Healthcare Data Breaches
SDG Viz Project
Visualize data about Sustainable Development Goals provided by the World Health Organization.
Web: SDG Viz Project
Twitter: #TheSDGVizProject
COP26 UN Climate Change Conference: #VIZ4CLIMATEACTION
Preppin' Data
A weekly challenge to help you learn to prepare data and use Tableau Prep.
Web: Preppin’ Data
Twitter: #PreppinData
Week 33: Excelling at adding one more row
Real World Fake Data
Create business dashboards using provided data sets for various industries and departments.
Web: Real World Fake Data
Twitter: #RWFD
Dataset #12: Hospitality
Viz 2 Educate
Each month, create vizzes on global education syllabus topics as resources for teachers worldwide.
Web: Viz 2 Educate
Twitter: #Viz2educate
Topic: Microbiology
Diversity in Data
An initiative centered around diversity, equity & awareness by visualizing provided datasets each month.
Web: Diversity in Data
Twitter: #DiversityinData
Viz for Social Good
Volunteer to design data visualizations that help nonprofits harness the power of data for social change.
Web: Viz for Social Good
Twitter: #VizforSocialGood
Relaterade berättelser
Subscribe to our blog
Få de senaste Tableau-uppdateringarna i din inbox.


