DataFam Roundup: April 26 - April 30, 2021
Dig into the latest DataFam Roundup—a weekly blog post that brings together what’s trending in the community all in one post. As always, we invite you to send us your content—and the DataFam content from your peers that have inspired you! Find the content submission form here.
DataFam content
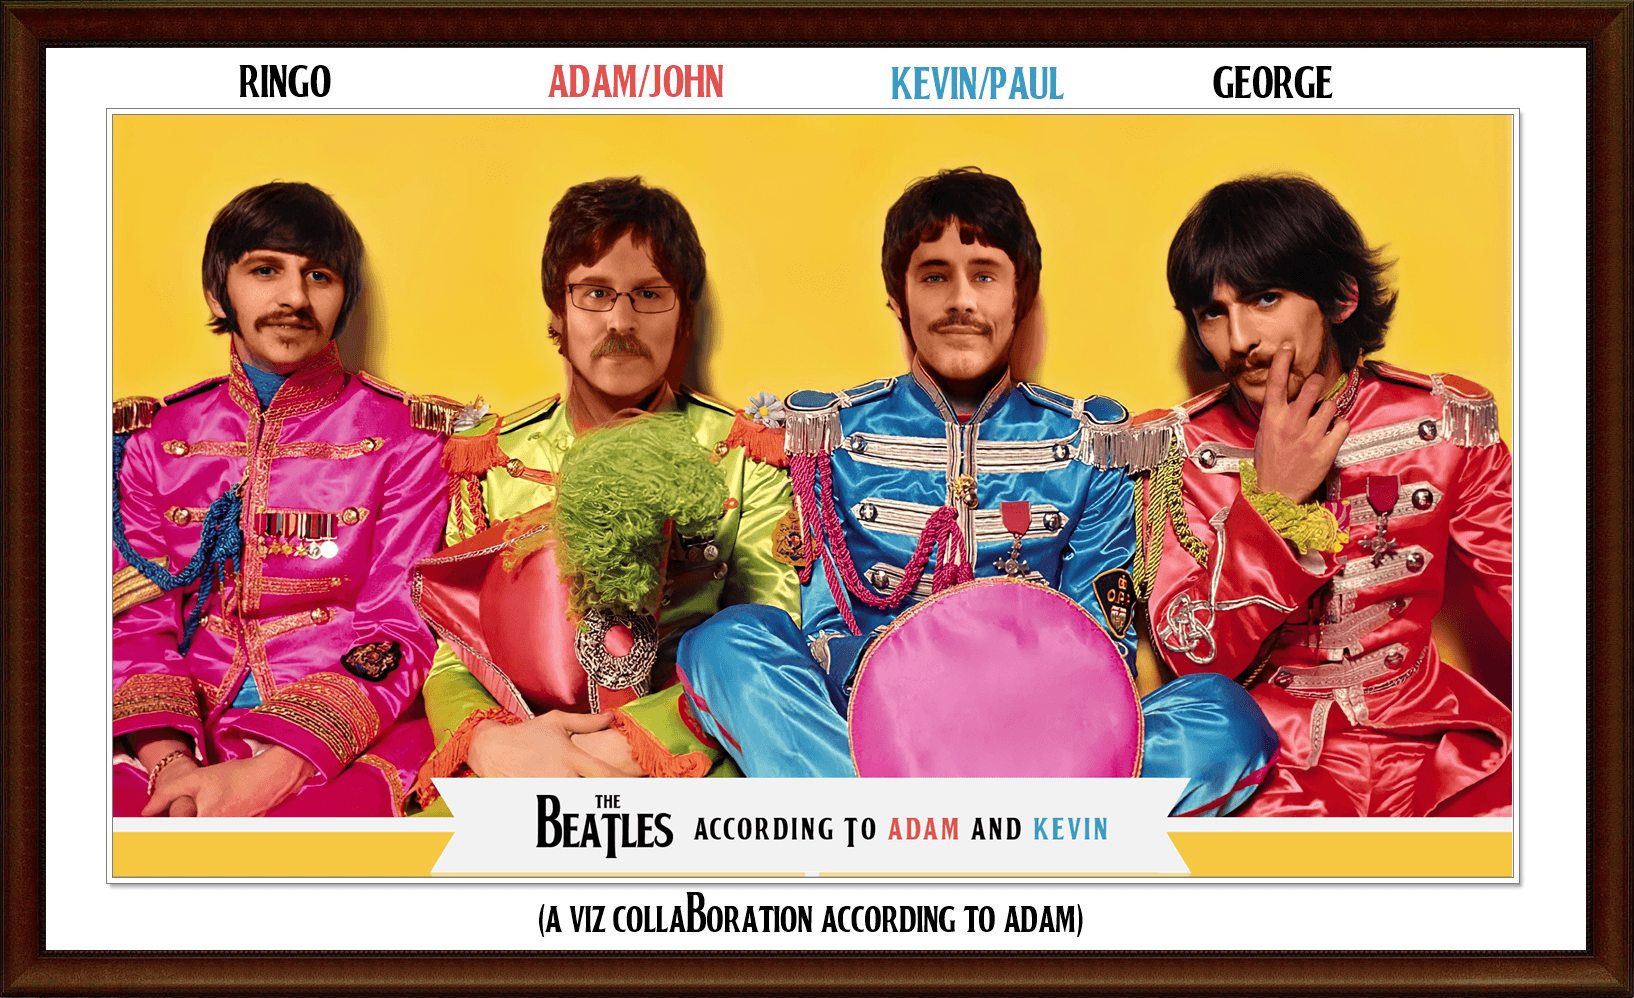
The Ballad of My Viz Collaboration with Kevin Flerlage (according to me), Adam Mico
Dive into content created by the Tableau Community:
- The Ballad of My Viz Collaboration with Kevin Flerlage (according to me) Adam Mico
- Tableau Public APIs Plus a VOTD Data Set Ken Flerlage
- “高级业务分析的必由之路”——从Quick LODs说起 Yupeng Wu (chinese)
- Visual Analytics at Spotify Peter Gilks and Jacob Olsufka
- Tableau Brush Filter Extension Joti Gautam
- Adding Percentage Lines to Bars Marc Reid
Upcoming events

DataDev Day
Join an upcoming Tableau User Group event:
- May 4, 2021: Turbo Tableau Server Talks
- May 12, 2021: Blacks in Analytics User Group: Leveraging Data and Tableau for Social Change
- May 20, 2021: Super TUG with Francois!
Check out all the virtual Tableau User Group events here.
May 4, 2021 Data Book Club: Q&A with Alberto Cairo (How Charts Lie) Join the live event with the author Alberto Cairo. You can learn more about the Data Book Club and sign up for our next round here.
May 20, 2021 Tableau’s first DataDev Day: We’re excited to announce a new, one-day event dedicated to DataDevs and anyone interested in or using the Tableau developer platform to create integrations and customize Tableau for their organizations.
View recording of Chart Chat Round 21: Watch as Jeffrey Shaffer, Steve Wexler, Amanda Makulec, and Andy Cotgreave, debate the good, the bad, and the “scaredy-cats” of data visualization.
Vizzes

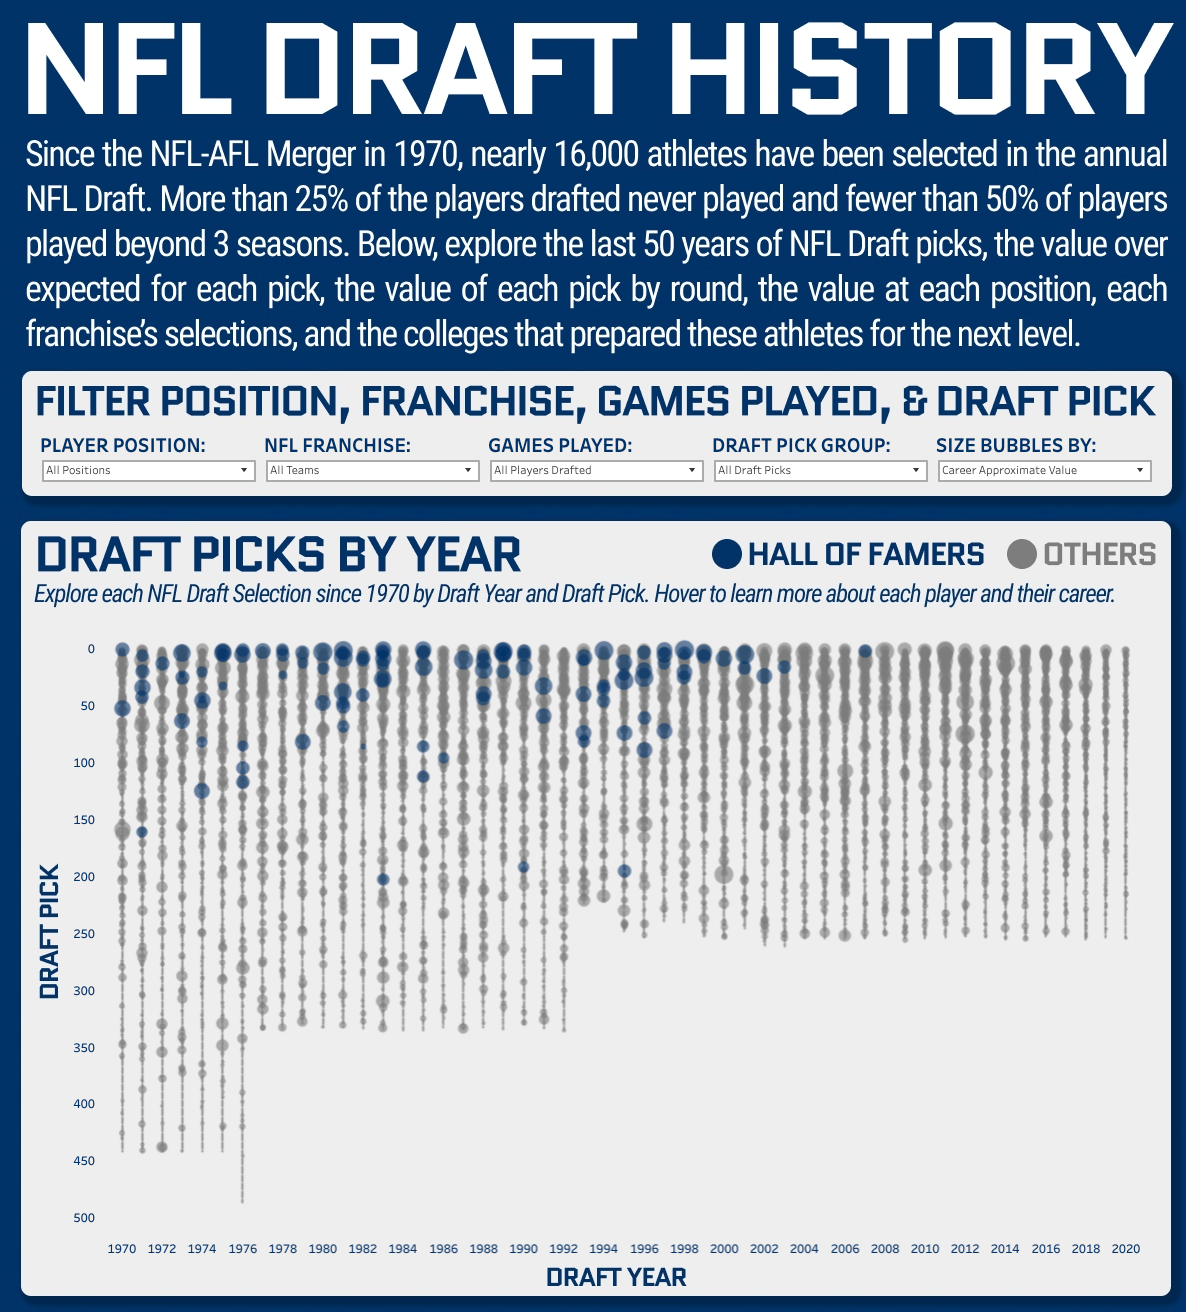
NFL Draft History: 50 Years of Selections, Sam Epley
Catch this week’s Viz of the Days here and subscribe to get them emailed directly to your inbox.
Check out some inspirational vizzes created by the community:
- Where In The World Is Tina? Kevin Magnan
- NFL Draft History: 50 Years of Selections Sam Epley
- 地方ごとの鶯初鳴き日の変遷(20210427和vizユーザ会) Yusuke Nakanishi
- #RWFD | Higher Education Abhinav KR
- Curriculum Vitae-2021 Yash Sakhuja
Community Projects

Stay in the loop on the Tableau Community Projects:
Makeover Monday
Join the community every Monday to work with a given data set and create better, more effective visualizations.
Web: Makeover Monday
Twitter: #MakeoverMonday
Week 17: Regional Price Parity For Each State
Workout Wednesday
Build your skills with a weekly challenge to re-create an interactive data visualization.
Web: Workout Wednesday
Twitter: #WOW2021
Week 17: Generation Population
Sports Viz Sunday
Create and share data visualizations using rich, sports-themed data sets in a monthly challenge.
Web: Sports Viz Sunday
Twitter: #SportsVizSunday
April 2021: NCAA D1 Lacrosse
Iron Quest
Practice data sourcing, preparation, and visualization skills in a themed monthly challenge.
Web: Iron Quest
Twitter: #IronQuest
April 2021: Diversity in Entertainment
Storytelling with Data
Practice data visualization and storytelling skills by participating in monthly challenges and exercises.
Web: Storytelling with Data
Twitter: #SWDChallenge
April 2021: ask & answer
Project Health Viz
Uncover new stories by visualizing healthcare data sets provided each month.
Web: Project Health Viz
Twitter: #ProjectHealthViz
April 2021: Quantified Self
SDG Viz Project
Visualize data about Sustainable Development Goals provided by the World Health Organization.
Web: SDG Viz Project
Twitter: #TheSDGVizProject
Goal 15: Life on Land
Preppin' Data
A weekly challenge to help you learn to prepare data and use Tableau Prep.
Web: Preppin’ Data
Twitter: #PreppinData
2021 Week 17: Timesheet Checks
Real World Fake Data
Create business dashboards using provided data sets for various industries and departments.
Web: Real World Fake Data
Twitter: #RWFD
Dataset #10: Higher Education
Viz 2 Educate
Each month, create vizzes on global education syllabus topics as resources for teachers worldwide.
Web: Viz 2 Educate
Twitter: #Viz2educate
April: Arts & Music
Diversity in Data
An initiative centered around diversity, equity & awareness by visualizing provided datasets each month.
Web: Diversity in Data
Twitter: #DiversityinData
March 2021: Adaptive Sports
Viz for Social Good
Volunteer to design data visualizations that help nonprofits harness the power of data for social change.
Web: Viz for Social Good
Twitter: #VizforSocialGood
April 22 - May 20, 2021: Crowd2Map
Relaterade berättelser
Subscribe to our blog
Få de senaste Tableau-uppdateringarna i din inbox.


