DataFam Roundup: April 19 - April 23, 2021
Welcome back! Dig into the latest DataFam Roundup—a weekly blog post that brings together what’s trending in the community all in one post. As always, we invite you to send us your content—and the DataFam content from your peers that have inspired you! Find the content submission form here.
DataFam content
Learn to Build this Sectional Radar Chart and Other Non-Traditional Charts, Kevin Flerlage
Dive into content created by the Tableau Community:
- Tableau Online Dashboard - How To Do Auto-Refresh Every 5 min? Rajeev Pandey
- An Interview with Kasia Gasiewska-Holc Adam Mico
- 写在数据故事慧一周年 Andy Huang 数据主厨 (Chinese)
- Learn to Build this Sectional Radar Chart and Other Non-Traditional Charts Kevin Flerlage
- Tableau Public won't publish Error [SOLVED] Jellyman Education
- New video: Chart Appreciation, Black vs. White Boys and The Punishing Reach of Racism Robert Kosara
- How I became a Tableau Desktop Certified Associate (and you can too) Marian Eerens
- How do you build inspired analytics communities? Neil Richards
- The Most Important Role You’re Not Hiring for Your Data Team: The Information Architect Lilach Manheim
- COVID-19 Vaccine Dashboard Collaboration Lindsay Betzendahl
- Data + Love, Datafam News - Season 3 Finale/Series Finale? Mark Bradbourne
- Building a Tableau scorecard dashboard: time period comparison visuals (part 4) Elliott Stam
- Consulting at DataDrive | Four Highlights Jeff Plattner
Celebrating DataFam Portfolio Day
The Tableau Community was one of many that celebrated #PortfolioDay on April 22, 2021. Flip through some of the inspiring vizzes created by the DataFam!
Upcoming events

DataDev Day
Join an upcoming Tableau User Group event:
- April 26, 2021: Analytics TUG
- April 28, 2021: Ahmedabad Fireside Chat with Francois
- May 4, 2021: Turbo Tableau Server Talks
- May 20, 2021: Super TUG with Francois!
Check out all the virtual Tableau User Group events here.
May 20, 2021 Tableau’s first DataDev Day: We’re excited to announce a new, one-day event dedicated to DataDevs and anyone interested in or using the Tableau developer platform to create integrations and customize Tableau for their organizations.
Vizzes

Great Lakes, Alexander Varlamov
Catch this week’s Viz of the Days here and subscribe to get them emailed directly to your inbox.
Check out some inspirational vizzes created by the community:
- My Book Tracker Priyanka Dobhal
- Pick a Chart - Design Tip Zak Geis
- #DiversityinData | Lack of Racial Diversity Among Winners at the Oscars Ali Tehrani
- Great Lakes Alexander Varlamov
- The Beatles According to Adam Mico and Kevin Flerlage (A Viz Collab) Adam Mico and Kevin Flerlage
- 49 Women Empowerment Songs Yanming Guo
- My Covid-19 Home Quarantine Experience Siddhanth Shetty
Community Projects

Stay in the loop on the Tableau Community Projects:
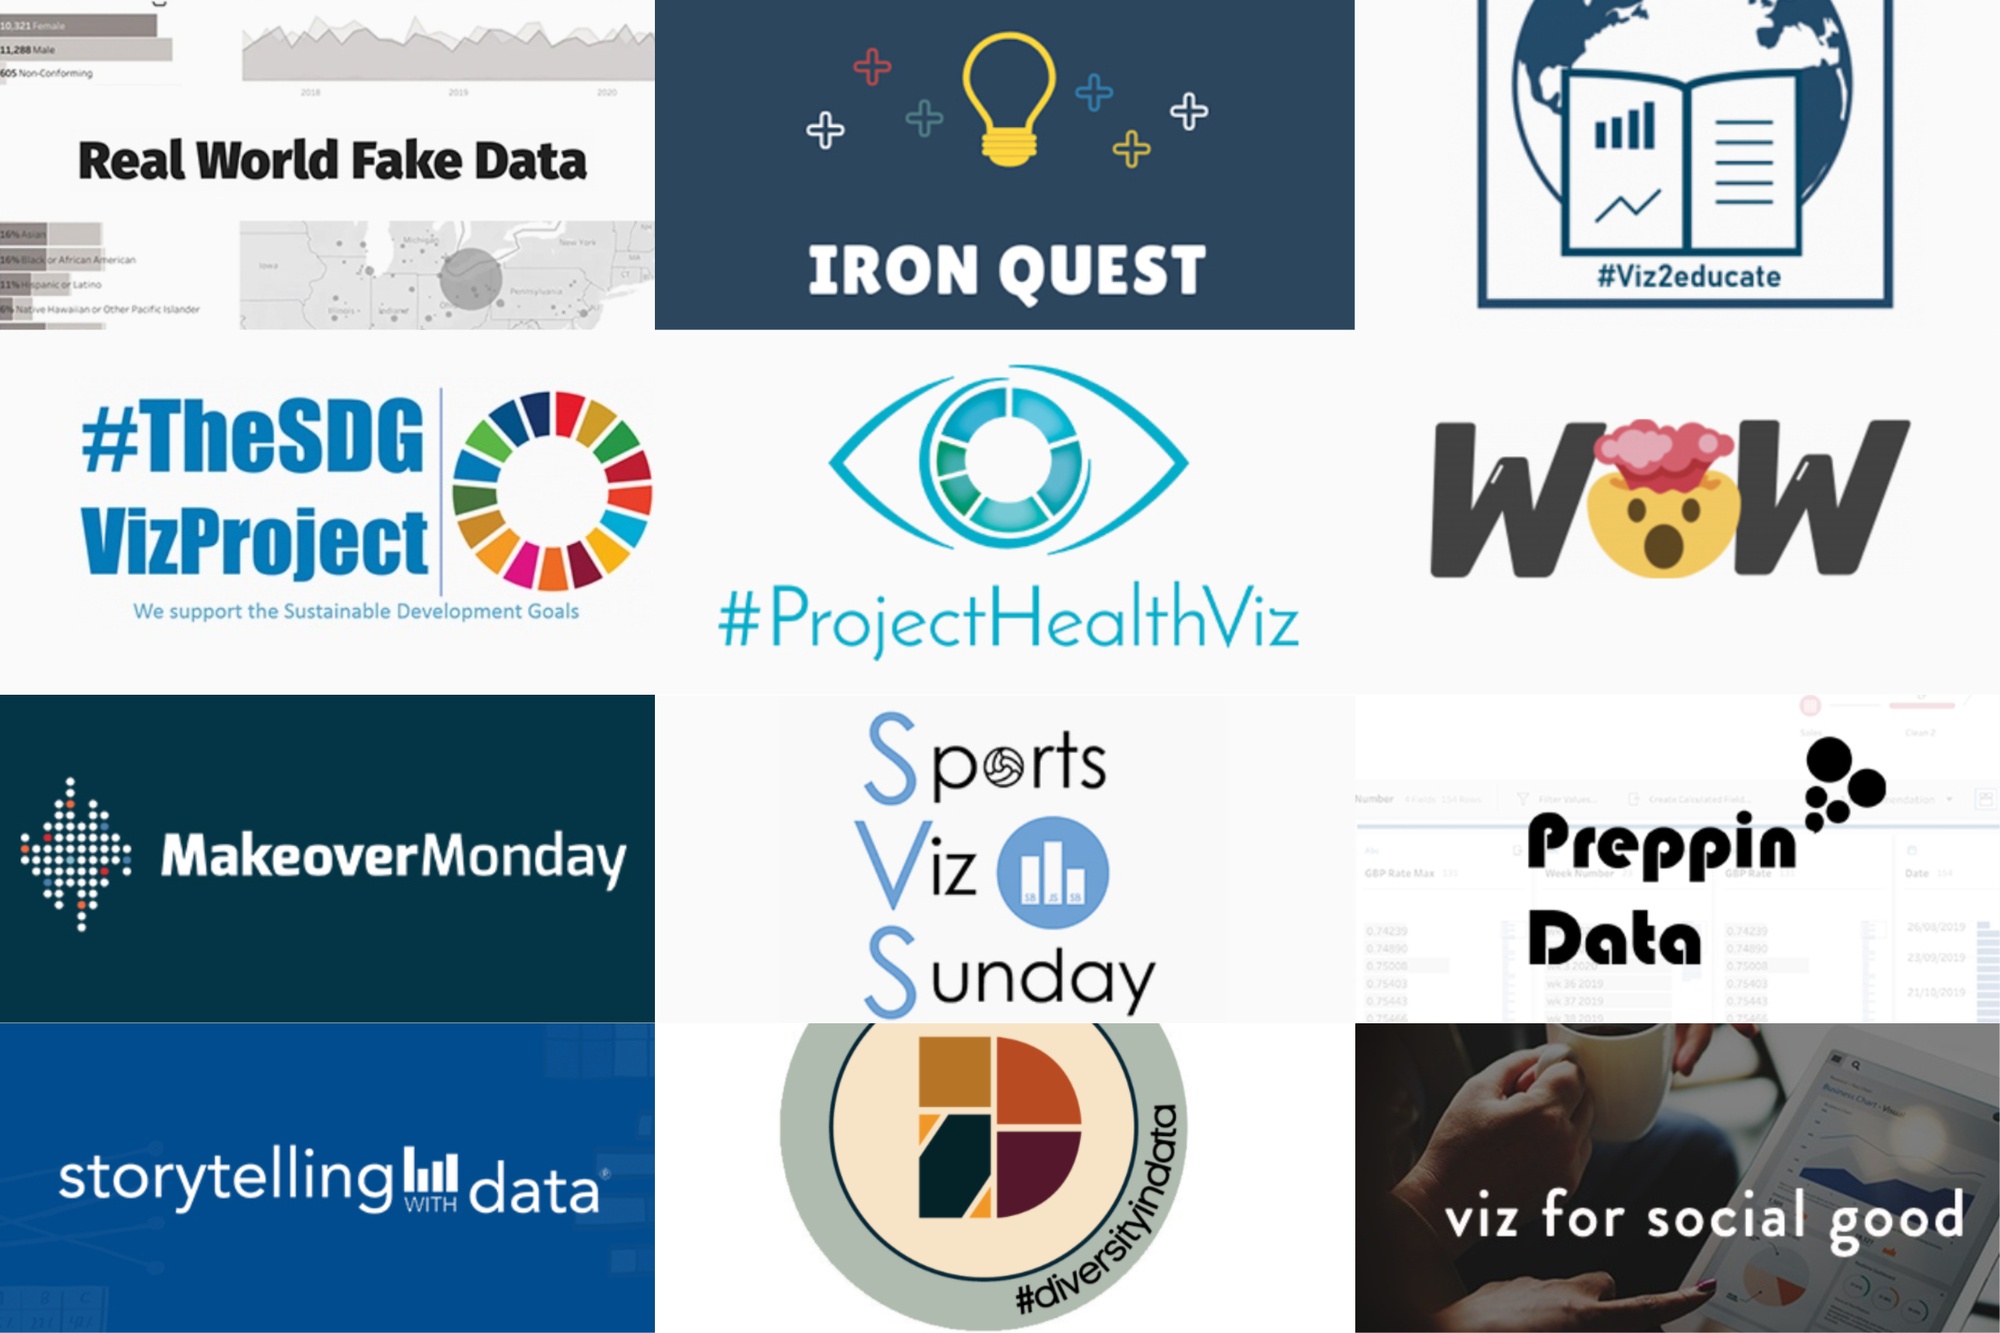
Makeover Monday
Join the community every Monday to work with a given data set and create better, more effective visualizations.
Web: Makeover Monday
Twitter: #MakeoverMonday
Week 16: US Air Travel Falls Due to Covid Epidemic
Workout Wednesday
Build your skills with a weekly challenge to re-create an interactive data visualization.
Web: Workout Wednesday
Twitter: #WOW2021
Week 16: Can you use Quick LODs to recreate this view?
Sports Viz Sunday
Create and share data visualizations using rich, sports-themed data sets in a monthly challenge.
Web: Sports Viz Sunday
Twitter: #SportsVizSunday
April 2021: NCAA D1 Lacross
Iron Quest
Practice data sourcing, preparation, and visualization skills in a themed monthly challenge.
Web: Iron Quest
Twitter: #IronQuest
April 2021: Diversity in Entertainment
Storytelling with Data
Practice data visualization and storytelling skills by participating in monthly challenges and exercises.
Web: Storytelling with Data
Twitter: #SWDChallenge
April 2021: ask & answer
Project Health Viz
Uncover new stories by visualizing healthcare data sets provided each month.
Web: Project Health Viz
Twitter: #ProjectHealthViz
April 2021: Quantified Self
SDG Viz Project
Visualize data about Sustainable Development Goals provided by the World Health Organization.
Web: SDG Viz Project
Twitter: #TheSDGVizProject
March 2021: Goal 15- Life on Land
Preppin' Data
A weekly challenge to help you learn to prepare data and use Tableau Prep.
Web: Preppin’ Data
Twitter: #PreppinData
2021 Week 16: The Super League
Real World Fake Data
Create business dashboards using provided data sets for various industries and departments.
Web: Real World Fake Data
Twitter: #RWFD
Dataset #10: Higher Education
Viz 2 Educate
Each month, create vizzes on global education syllabus topics as resources for teachers worldwide.
Web: Viz 2 Educate
Twitter: #Viz2educate
April: Arts & Music
Diversity in Data
An initiative centered around diversity, equity & awareness by visualizing provided datasets each month.
Web: Diversity in Data
Twitter: #DiversityinData
March 2021: Adaptive Sports
Viz for Social Good
Volunteer to design data visualizations that help nonprofits harness the power of data for social change.
Web: Viz for Social Good
Twitter: #VizforSocialGood
April 22 - May 20, 2021: Crowd2Map
Relaterade berättelser
Subscribe to our blog
Få de senaste Tableau-uppdateringarna i din inbox.


