8 tips for deploying Tableau at scale

TabJolt
Organizations of all sizes are delivering true self-service analytics at scale with Tableau. They are strategically transforming their organizations and building an analytical culture that will be vital to their future. As that culture builds, your analytics platform becomes mission-critical to your organization, and downtime becomes a real concern. Proper deployment and scalability planning are essential to minimizing downtime and ensuring your analytics platform can meet the ever-growing needs of the business.
There are many things to consider when setting up an enterprise environment, so here are eight quick tips to help you set up your Tableau environment with a framework for scalability.
1. Design your workbooks for beauty and performance
When we hear a customer suggest that their workbook is slow, it’s most often because it was designed without performance in mind. If a single user load time is slow, the workbook response times will be slow under heavy loads as well.
While adopting a culture of analytics, providing avenues and teams where stewards can help users design great-looking, insightful workbooks that perform well will enable you to ensure you build and deliver scalable visualizations as well. Designing Efficient Workbooks is a whitepaper that dives deeper into building efficient dashboards that perform well.
2. Consider your data strategy
The total response time an end user experiences is a combination of many things, but it’s primarily time taken by Tableau combined with data retrieval. If your backend databases are slow or your query times are slow, the visualizations will be slow.
It’s important to factor in your data strategy. Oftentimes, data sources in an organization are curated and shared. You must ensure that you are delivering data that matters in a way that the data can support business user productivity. This means optimizing data. For example, you should be ensuring optimal joins and relevant levels of aggregation for fast queries against indexed tables. Having a good data hygiene process is important to keep visualizations and dashboards performing well.
3. Use Tableau data extracts when needed
If your database queries are slow, and you can't work with your DBA and IT teams to optimize the performance, consider using extracts to increase query performance. Extracts are stored locally on the server and run in-memory so that users can access the data quickly without making requests to the database. Extracts can be filtered and aggregated easily. You can easily train your end users to optimize the extracts before publishing to server when needed, by aggregating at the correct levels and hiding unused fields. Extracts significantly improve response time and enable your users to get into the analytic flow.
4. Schedule updates during off-peak times and separate Backgrounders
Data sources are often updated in real-time, but users only need data daily or weekly. Scheduling extracts for off-peak hours can reduce peak-time load on both the database and Tableau Server. In addition, you could add additional Backgrounders on dedicated hardware if you have sufficient core capacity. Consider this option for faster completion of extracts.
Eliminate wasted cycles by identifying extract that are being refreshed unnecessarily. For example, if you have a large extract that refreshes every hour, but the workbook using that extract was last used over an year ago, ask your business users if they really need that extract refreshed every hour. Removing work from the server that is not relevant and/or critical to the business gives your users a more optimized experience.
5. Caching
Caching in Tableau is distributed across the cluster and as such the memory use from scaling server can be distributed across the cluster nodes by simply adding more cache servers. Cache Servers specifically cache query results and will improve scale in use cases where more users are viewing a visualization where the query results are already cached. Want to know if you are hitting or missing caches, turn on JMX monitoring on server and use your favorite JMX monitoring tool or use TabMon.
6. Tune your configuration
The default configuration works for most small deployments. However, when doing your own scalability testing, remember you may need to tweak your configuration for number of VizQL servers, cache servers, data engines, and data server. Consider whether you should tweak settings for internal process monitors (SRM) for memory (vizqlserver.memory_limit_per_process_gb) based on the hardware you are testing on. These internal process monitors by design will restart server processes when it detects systems over thresholds and there isn’t sufficient capacity.
7. Leverage TabJolt
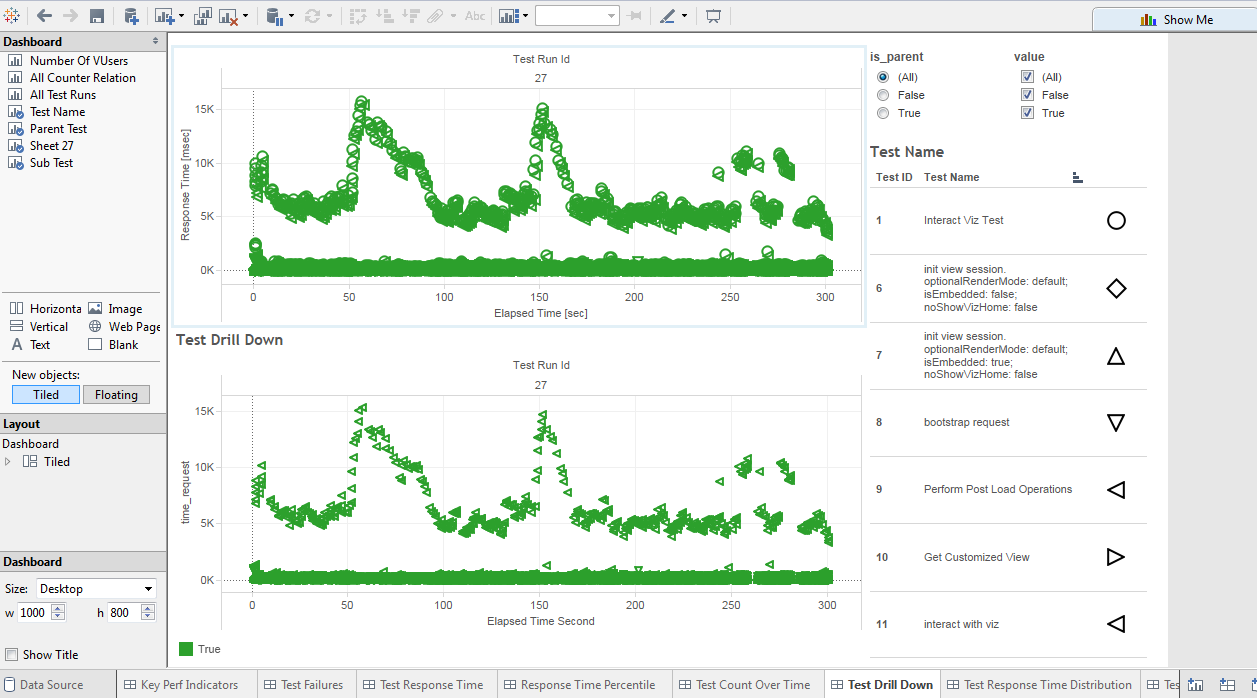
Consider using TabJolt for load-test automation, since it eliminates the need for you to update and maintain test automation scripts. Upkeep of test automation scripts for ad hoc analytics can be very time-consuming and limit your coverage. Here is a video on how to get started with TabJolt.
8. Running on VMWare
If you are running your Tableau Server on VMWare, remember to work with your VMWare vSphere administrators to ensure they have allocated sufficient CPU reservation to allow Tableau to receive the core compute it needs for processing the intensive workloads for visualization.
For additional tips on scaling your Tableau deployment, check out our whitepaper on Tableau Server scalability.
Relaterade berättelser
Subscribe to our blog
Få de senaste Tableau-uppdateringarna i din inbox.


