New in Tableau 8: 7 Reasons to Use Google Analytics + Tableau
So you're a web analytics junkie. Or you're at least web-analytics interested... And you've been using Google Analytics. The reporting console seems pretty good. No need to use Tableau, right?
Wrong. Google Analytics is a great free tracking tool, but if you rely on it for analytics you're leaving insight on the table. Tableau 8 has a direct connector to Google Analytics. Here are 7 reasons to use it.
Blend (aka mashup) data to show your website in context.
Group to add another layer of intelligence.
Filter to focus your analysis.
Make everyone your smartest analyst.
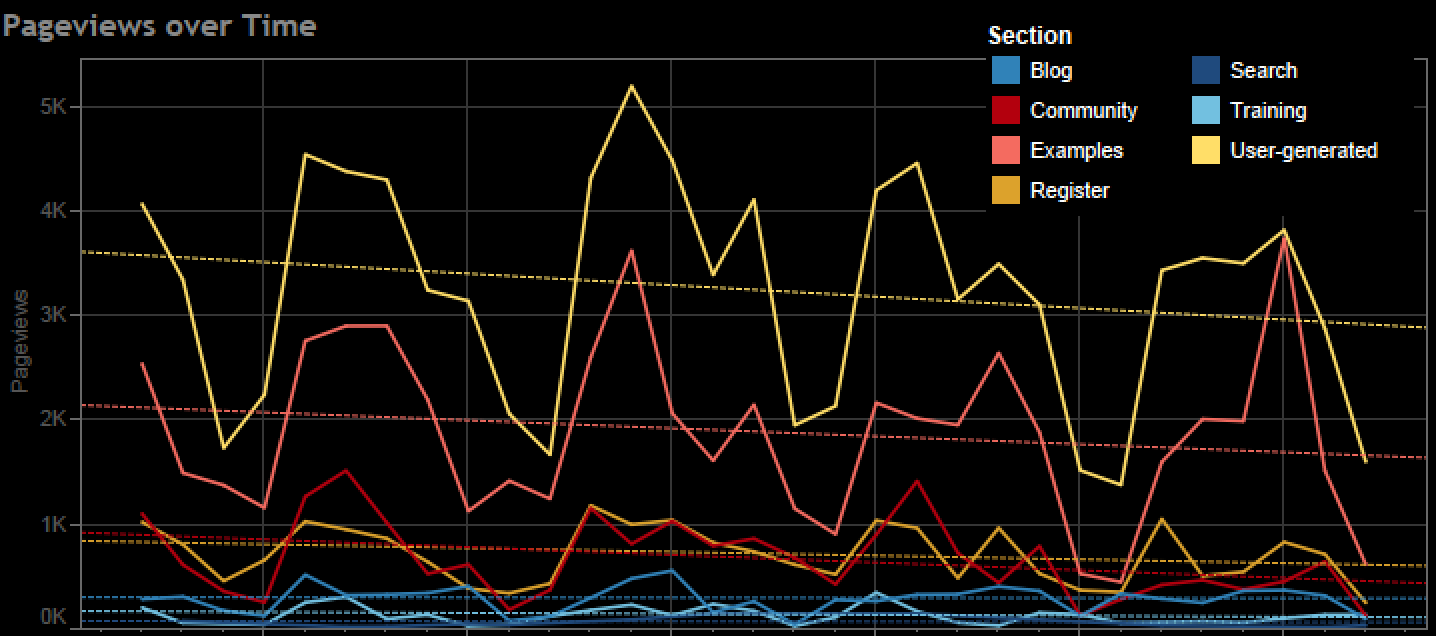
Use trendlines to, well, see trends.

Use Quick Calculations to turbocharge your analysis.
Do previous page/ next page analysis.
Last tip: Google Analytics uses sampling, which means that ratios like bounce rate and exit rate can be very wrong when viewed in the aggregate. Always bring absolute measure (bounces, exits) into Tableau and calculate rates there. And GA has a 500,000 row limit for any one API call, so take extracts under the limit and then combine your extracts for the complete – and unsampled – picture.
Download Tableau 8 (now in beta) to try these out for yourself (contact your salesperson if you need access). And watch this blog to learn more about Tableau + Google Analytics.
Subscribe to our blog
Få de senaste Tableau-uppdateringarna i din inbox.


