A 16yr Old Wants a Career in Data Visualization. What Advice Do You Give Him?
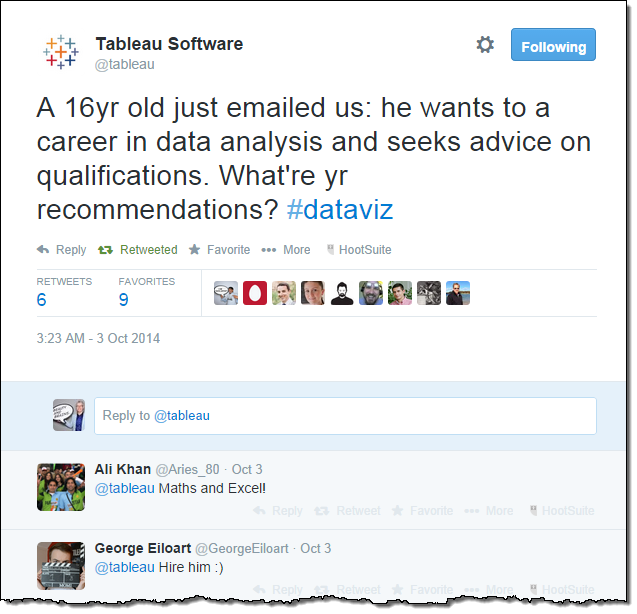
We received an email from Louis Booth, a 16yr old, looking for advice on how to prepare for a career in data analysis and visualization. We gave him some advice and also sought yours. What should students do today to prepare for a great job in the future?
We received an email last week from Louis Booth. He’s sixteen and wants to pursue a career in data visualisation. We are always happy to receive this kind of email and it’s great to see that data visualization is increasingly seen as a valid career path.
We gave him some advice but we also seek your advice. What should students thinking about life after school do to get a great job in this area?
We turned to social media as well as collecting some of our own ideas.
The response on social media was great. You can see the responses yourself on Twitter and Facebook.

Our advice was this:
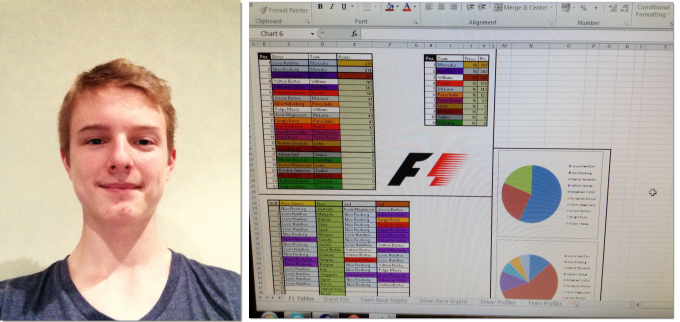
Below is a picture of Louis and some of the work he's been doing in Excel. Do you have advice for him and others like him? Let us know in the comments below. We would like to thank Louis for his question and wish him the best of luck for the future.

Finally – if you feel like you’ve got the skills, and want to work for Tableau, please check out our careers page.

Our advice was this:
- Get active on social media: follow the data visualization thoughts leaders and contribute to the debate. We recommend 2 lists: thought leaders in data visualisation and people who tweet about Tableau.
- Get your hands dirty with data! Find some great data related projects to try. Download a copy of Tableau Public so you can experiment and share your work. You could set up a free blog in minutes (here’s instructions) and post your work: then ask for criticism. The community online is very helpful and passionate about helping people out. As a student, you can even request a full, free copy of Tableau via our Academic Program. You could take this further and create a "Data Club" at school.
- As for skills, a great data analyst needs many diverse skills. Andy Kirk covers this in his "8 hats of data visualization" articles.
- Do a degree or course on data visualization or related field. There are many university programs, or you could enroll on a MOOC. For example here is a list of stats-related courses available on Coursera.
- Read some books. Here are the ones I recommended a year back. Andy Kirk also has some recommendations.
Below is a picture of Louis and some of the work he's been doing in Excel. Do you have advice for him and others like him? Let us know in the comments below. We would like to thank Louis for his question and wish him the best of luck for the future.

Finally – if you feel like you’ve got the skills, and want to work for Tableau, please check out our careers page.
Relaterade berättelser
Subscribe to our blog
Få de senaste Tableau-uppdateringarna i din inbox.


