Tableau to the rescue in the collegiate classroom

I teach machine learning and statistics to MBA students at the Madras School of Economics.
I designed a project-oriented course, Analytics in Business, which is offered after the initial machine learning class. Students analyze relevant industry data sets, interpret results, and present their findings. It was meant to provide practical, hands-on experience to solidify their learning from earlier machine learning and Python programming classes.
Previous students attributed some of their success in campus placement to the practice they had in my classes where I emphasized model interpretation and presentation to business users.
The pandemic moved all classes online and changed the program structure for the term. Students were concurrently enrolled in both machine learning and analytics in business courses. I also changed the course emphasis from machine learning to management reporting and designed the content to help students connect the dots from data to decision-making.
Since students had completed a Python programming class, I assumed a certain fluency and assigned them data sets, asking them to choose metrics and write management reports to track the ones that supported their decision-making. But the class struggled using Python and Excel to deliver results; they spent a lot of time wrestling with code rather than learning what the data told them. And I wanted them to familiarize and skill up on a data visualization tool to help in their job placement. Because not all students may get hired as data scientists—the brightest who have an aptitude for data visualization will be more marketable and ideal candidates for Business Intelligence and Data Analyst roles.
Tableau fit the bill for the following reasons, in both the short, medium, and long-term, supporting the success of my students and their increased understanding of analytics in business.
-
Immediate: Tableau is an industry leader in visual analytics, and it is available free to students.
-
Intermediate: As we worked with Tableau, we found it easy and intuitive to use, and there were plenty of training and online learning resources to draw from and consult.
-
Long-term: Tableau filled the gap between Python and Excel, perfectly. It required way less time than programming in Python and was more powerful than Excel for visualization. It was also a better use of students’ time; they rapidly became familiar with Tableau and used it to explore data and gather insights. The visualizations helped them make more powerful presentations to demonstrate their learnings and data literacy.

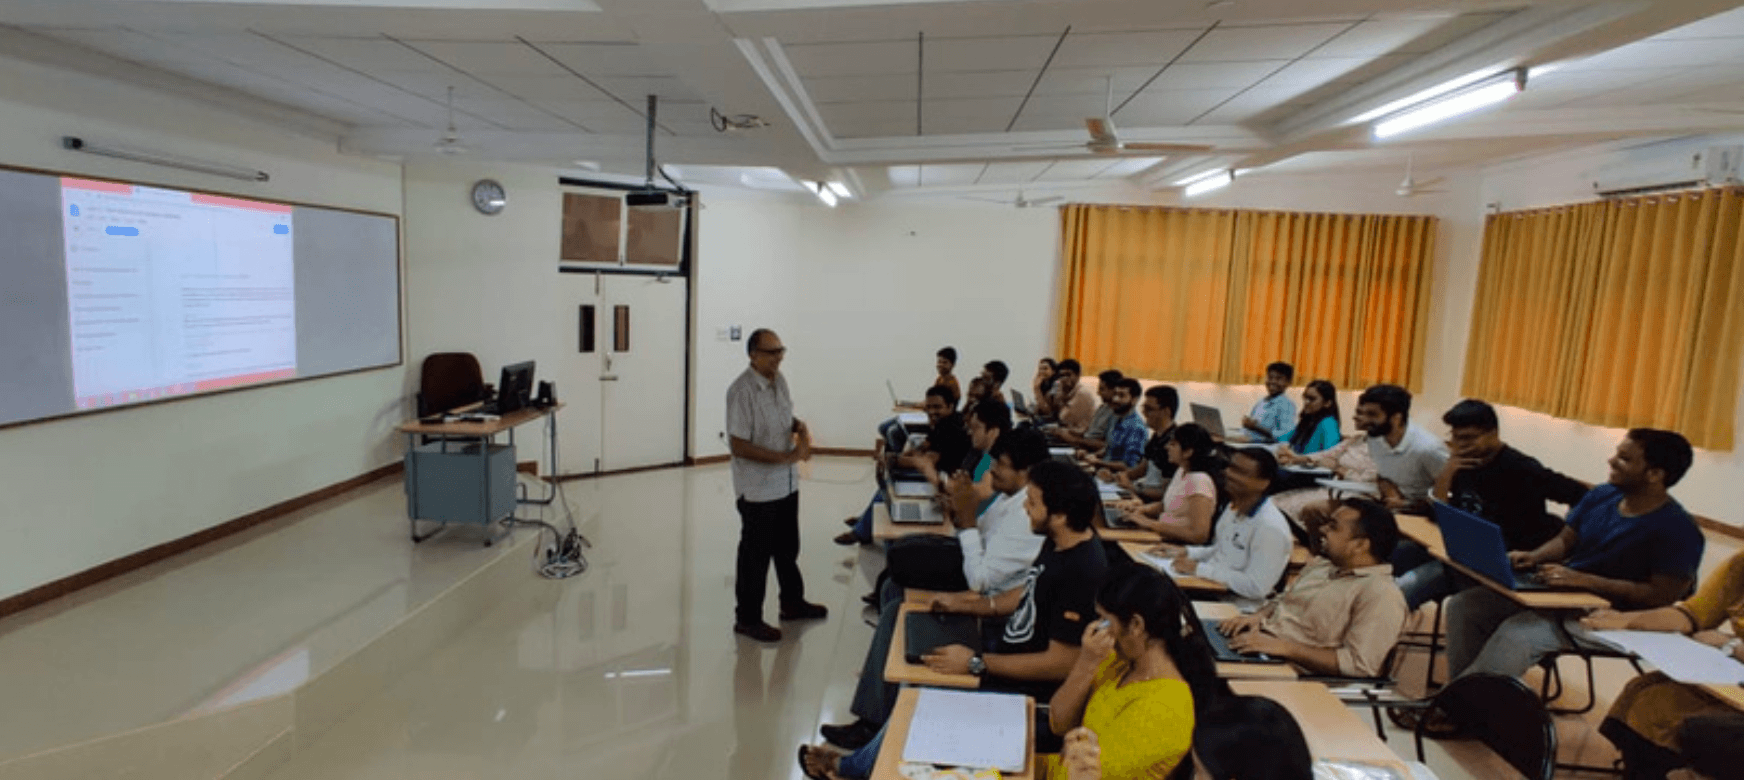
Ravi teaching his students at the Madras School Of Economics
My final exams usually contain a reflection question to help students introspect and consolidate what they learned. I asked them to write in a maximum of 200 words about their experiences, insights, and takeaways—maybe what affected them most, what new skill they learned, or if they look at the world in a new way. Based on their responses, I wanted to highlight select quotes from some of the students.
Student 1
“One of the tools I learned in this course was Tableau, which is a powerful visualization and analysis software. The hands-on experience, the discussion board, and supporting materials or articles provided by our instructor enhanced my learning of the subject. This course helped me to focus on thinking, task management, problem-solving, and communication skills.”
Student 2
“The bigger picture was mastering visualization with Tableau—a tool which I found really powerful, yet simple to learn with many embedded tools and functions that enable the analyst to work and bring visually-friendly insights. I learned several functions like date, string, LOD, Blend, Joins, and more.
I am pretty much sure Tableau will be my go-to tool, enabling me to find insights in such a powerful manner. What will I do when my one-year Tableau student subscription ends?”
Student 3
“Later, the course was re-structured, and Tableau was introduced. Finally, we started doing data analysis and practicing during the class to learn the software. Now, we have practiced enough to analyze any data set.”
Student 4
“Initially when I joined the course, I thought I needed to be a computer science engineer to start a career in business analytics as it deals with a lot of programming language. But it is a myth.
Storytelling throughout the course was a fundamental basis for delivering data sets. During the Tableau introduction, I was anxious. But using Tableau’s drag-and-drop functionalities, I created a very interactive visual within minutes that helped me explore different data and provide proper insights in my presentation.”
Student 5
“Tableau seemed difficult in the beginning but turned out to be the simplest way to read, visualize and interpret data. I worked as a financial research analyst, spending most of my work time gathering evidence and analyzing spreadsheets that ended in fatigue. But with sophisticated tools such as Tableau, I have sped up my work and now make better predictions.”
Student 6
"During this course, what we experienced was not a typical classroom setup, but a collaborative workspace where we learned from each other—be it a student or the professor. It helped me understand the math and analysis involved behind sales or marketing moves; before it, I never understood the “why” behind these different strategies. I also had a superficial knowledge of human resources.
With guest lectures, I learned how metrics and analyses help improve the efficiency of people and the organization. Introducing Tableau helped me gain knowledge on the metrics, their representation, and relevance. It was made very clear that anyone can have intuition on sales, marketing, or human resources, but it makes sense only when backed with data analysis.”
_________________
Want to teach Tableau in your classroom and empower your students with data skills? Request licenses through our Tableau for Teaching program today.
Histórias relacionadas
Subscribe to our blog
Receba em sua caixa de entrada as atualizações mais recentes do Tableau.


