DataFam Roundup: September 30 - October 4, 2024


Welcome! Dig into this week's DataFam Roundup—a weekly blog that brings together community content all in one post. As always, we invite you to send us your content—and the DataFam content from your peers that have inspired you! Find the content submission form here.
Community Highlight
To recognize new and consistent Tableau contributors—we’re excited to have a section within the weekly DataFam Roundup called the Tableau Community Highlight. Find out how to get involved.
Raisa Hannus, Freelance Business Analyst
Florida, USA
Raisa Hannus is a Freelance Business Analyst. She was first introduced to Tableau through an online course where she learned the basics of creating charts and got to try out the Back to Viz Basics community project. From there, Raisa was welcomed into the Tableau Community and all there is to offer. Community projects remain Raisa’s favorite part of the Tableau community, but she is also active in other areas including Tableau User Groups and Tableau Public.
Working with data is important to Raisa because she believes that visualizing data makes it more accessible to wider audiences and with so much data all around us, it is important to be able to understand it. One way Raisa is doing her part to make data more accessible is by publishing vizzes on Tableau Public. She gets inspiration from new chart types she wants to try and other visualizations by members of the Tableau community. In the near future, Raisa is excited about participating in Iron Viz qualifiers.
Connect with Raisa on Linkedin, X, and Tableau Public.
DataFam content
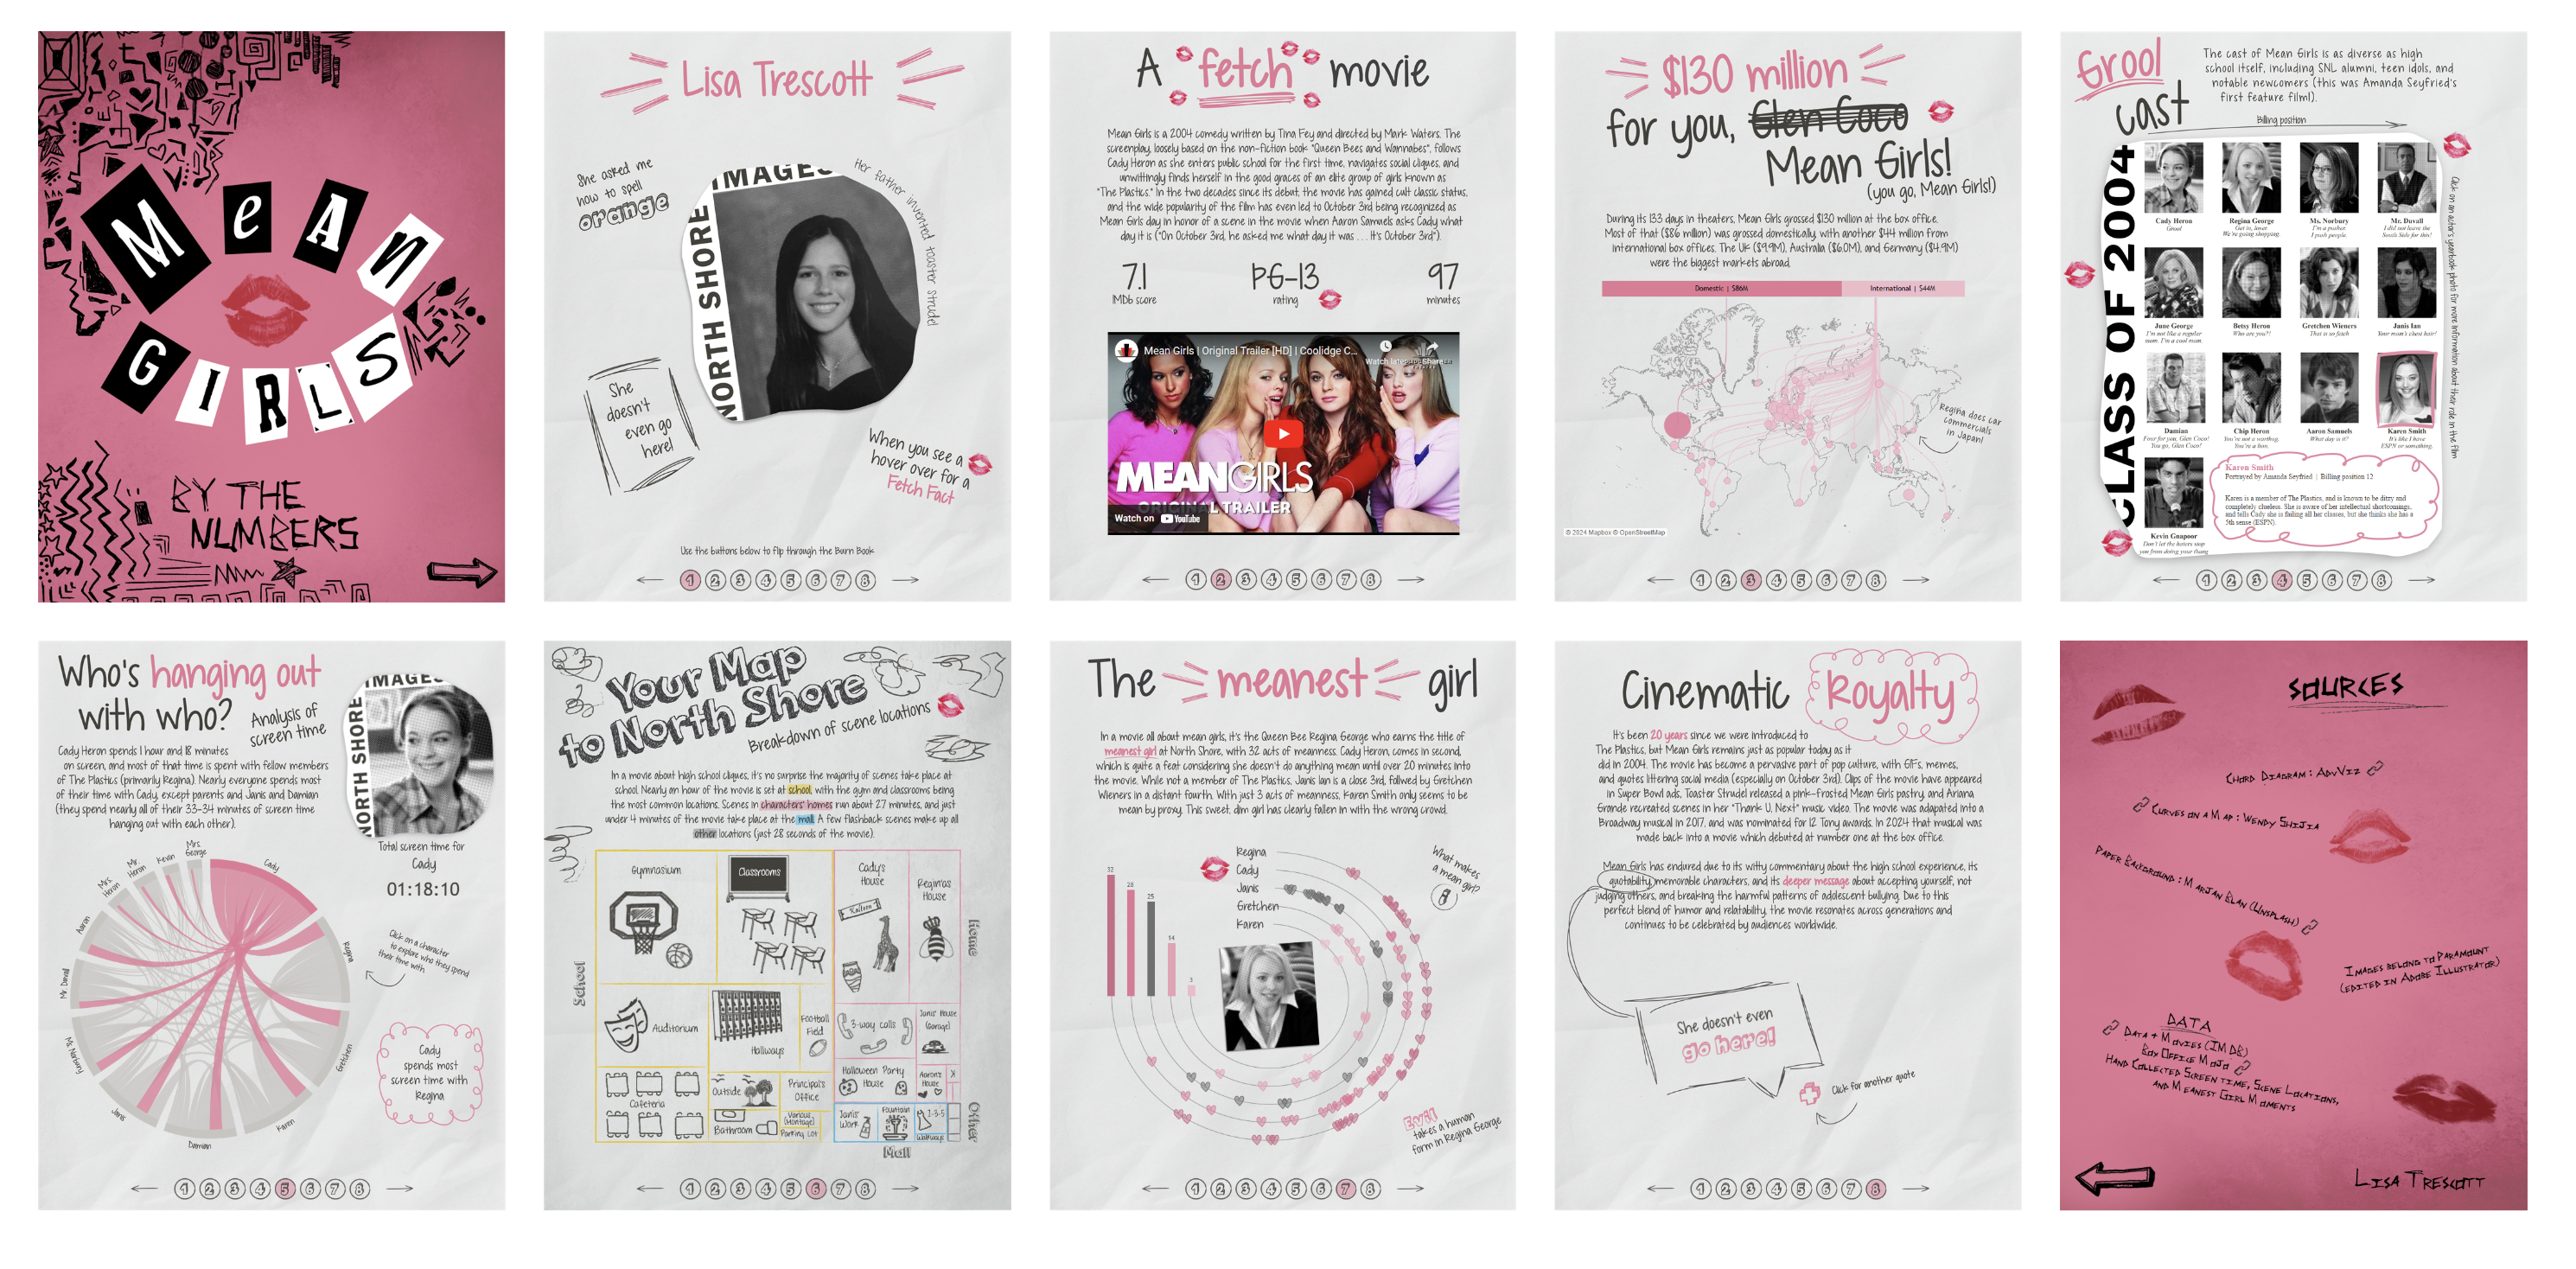
Lisa Trescott: Behind the Viz: Mean Girls
Dive into content created by the Tableau Community:
- Sean Miller: A Tableau Visionary’s Takeaways from Dreamforce 2024: AI, Tableau, and the Future of Analytics
- The Flerlage Twins: Dual-View Trend Chart (Guest Post from Kasia Gasiewska-Holc)
- Neil Richards: Data Art with Tableau · On Data And Design
- herdata: Announcing the Tableau Data Art Gallery: A Celebration of Creative Expression
- The Data Leadership Collaborative: The Future of the CDO: Community Roundtable
- Ray Givler: How Tableau Decides Where to Store Worksheet Cards
- Lisa Trescott: Behind the Viz: Mean Girls
- Robert Rouse, Action: The Design of Everyday KPIs #3: Merging Data Silos with a KPI Layer
- Deepak Holla: Understanding Tableau Concepts: Understand discrete and continuous fields
Team Tableau content
- Data Literacy Basics Everyone Should Know
- How To Spot Misleading Charts: Know the Source
- Featured Authors: 2024 Hispanic Heritage Month Edition
- Advocacy Through Human-Centered Data Visualization
Upcoming events and community participation
- Dreamin' in Data Dreamin’ in Data is the first Salesforce Community Conference purpose-built to help showcase the entire journey of your organization’s data, from Salesforce (your CRM), through integrations with other applications (using MuleSoft), and finally to analysis and determining the story your data is telling (using Tableau) – ultimately to help your organization make smarter decisions faster and stay ahead of your competition.
- Mark your calendars and join the Data Book Club as we explore, Chart Spark by Alli Torban, and the book's key themes and practical applications in our professional and personal lives. We will be meeting virtually starting August 2nd at 11am CT, but we also have a Slack space to discuss the book asynchronously as well as share notes, ideas, and resources!
- CRM Analytics Community Office Hours! Have CRM Analytics questions? Want to know how to work with data? Want to learn something new? Have visualization ideas you want to share or need feedback on? Want to just hang out with a bunch of us? Come join us (virtual)!
- DataFam Birthday Roundup! In the effort of continuing support for one another, we thought it would be fun to gather data on DataFam birthdays! If you're willing, could you let us know which day you celebrate your birthday? Just go ahead and pick the day from this year's calendar, since it's a leap year and all possible days are available to choose from!
- Mentorship Program by the Data Visualization Society
- Women in Dataviz Virtual Coffee Breaks: Held every sixth Thursday morning and every sixth Wednesday afternoon in the EST time zone, Virtual Coffee Breaks are a casual networking event. Feel free to drop in and out as you need toduring the hour, and stay for as little time or as long as you want.
Visualizations
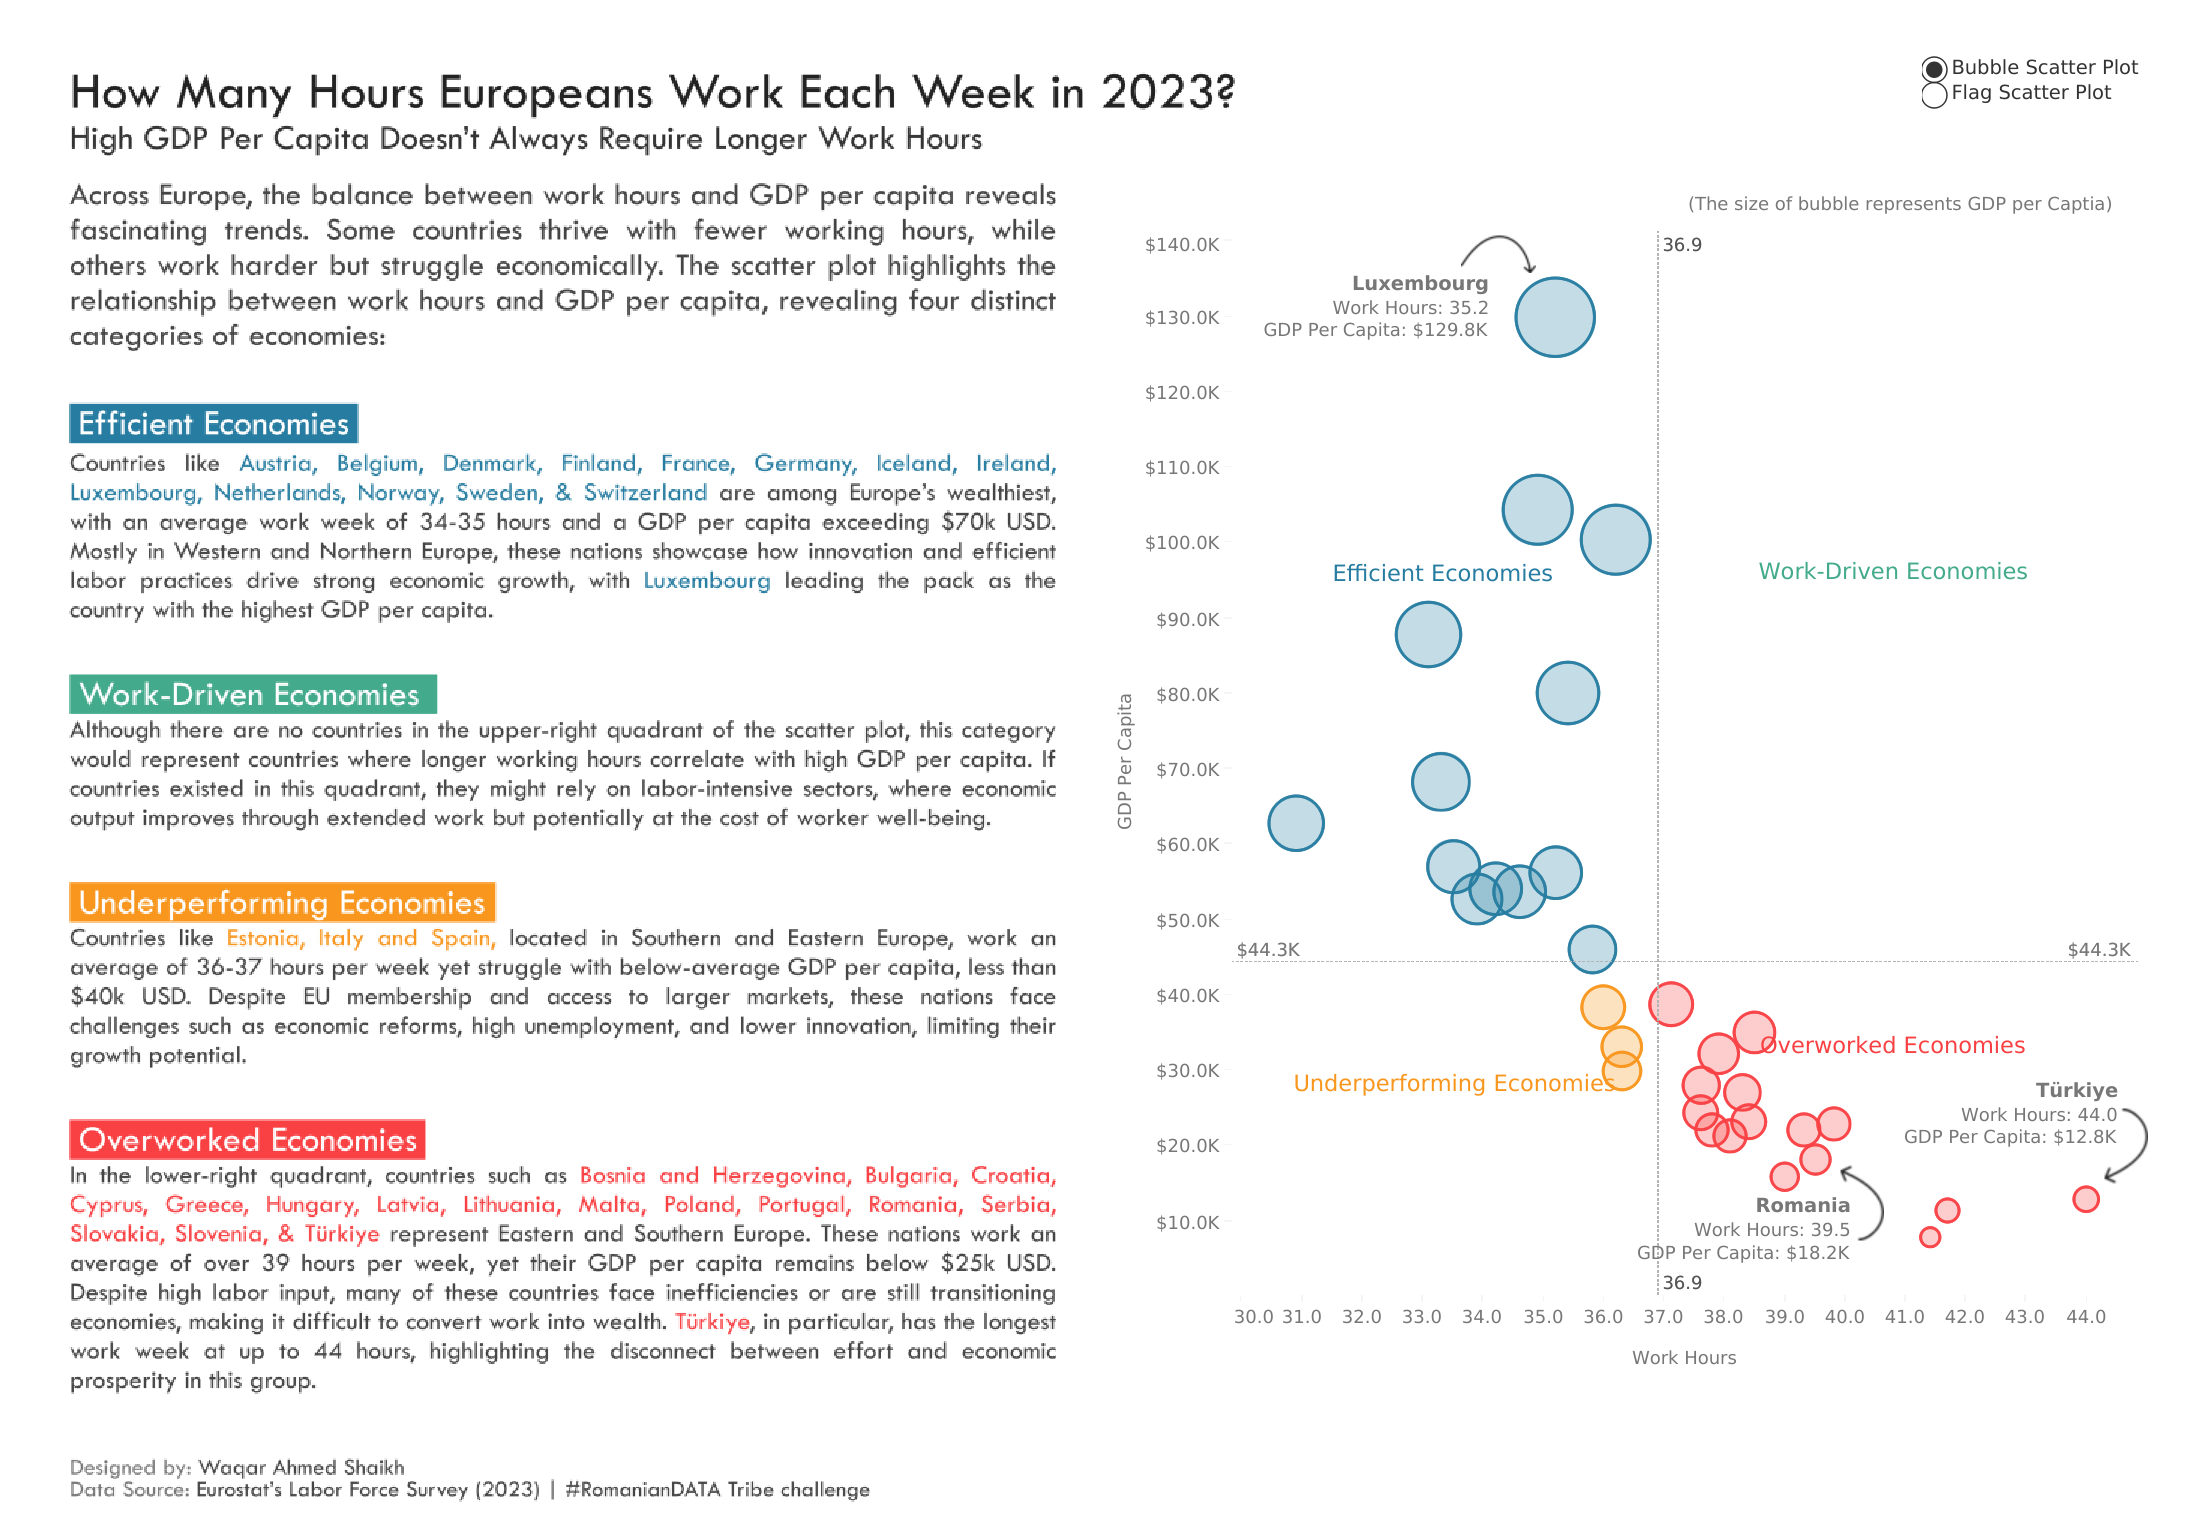
Waqar Ahmed Shaikh: How Many Hours Europeans Work Each Week in
See the latest Viz of the Day, trending vizzes, featured authors, and more on Tableau Public.
Check out some inspirational vizzes created by the community:
- Waqar Ahmed Shaikh: How Many Hours Europeans Work Each Week in
2023 - Lisa Trescott: Mean Girls By the Numbers
- Ojoswi Basu: LinkedIn Analytics
- Prasann Prem: The Color of Sleep
- Tamaball3: mom2024w40
Community Projects
Back 2 Viz Basics
A bi-weekly project helping those who are newer in the community and just starting out with Tableau. Not limited just to newbies!
Web: Back 2 Viz Basics
X: #B2VB
Week 19: Show Top N
Workout Wednesday
Build your skills with a weekly challenge to re-create an interactive data visualization.
Web: Workout Wednesday
X: #WOW2022
Week 40: Vrroom
Preppin' Data
A weekly challenge to help you learn to prepare data and use Tableau Prep.
Web: Preppin’ Data
X: #PreppinData
Week 38: Preppin' Consultancy Ranks
Makeover Monday
Create business dashboards using provided data sets for various industries and departments.
Web: Makeover Monday
X: #MakeoverMonday
Week 39: Historical Performances of Indices
Visual Climate
Collaborate and share climate data.
Web: Visual Climate
X: #VisualClimate
Gender Equality_ Women Entrepreneurship Participation
DataFam Con
A monthly challenge covering pop culture and fandoms.
Web: DataFam Con
X: #DataFamCon
September 2024: Live Long and Prosper with Star Trek
EduVizzers
A monthly project connecting real education data with real people.
Web: Eduvizzers
September 2024: Global Hunger Index (GHI)
Viz for Social Good
Volunteer to design data visualizations that help nonprofits harness the power of data for social change.
Web: Viz for Social Good
X: #VizforSocialGood
Games Night Viz
A monthly project focusing on using data from your favorite games.
Web: Games Nights Viz
X: #GamesNightViz
September 2024: Press Start
Iron Quest
Practice data sourcing, preparation, and visualization skills in a themed monthly challenge.
Web: Iron Quest
X: #IronQuest
Iron Quest – Maps II
Storytelling with Data
Practice data visualization and storytelling skills by participating in monthly challenges and exercises.
Web: Storytelling with Data
X: #SWDChallenge
July 2024: graphing for—or with—kids
Project Health Viz
Uncover new stories by visualizing healthcare data sets provided each month.
Web: Project Health Viz
X: #ProjectHealthViz
Diversity in Data
An initiative centered around diversity, equity & awareness by visualizing provided datasets each month.
Web: Diversity in Data
X: #DiversityinData
Sports Viz Sunday
Create and share data visualizations using rich, sports-themed data sets in a monthly challenge.
Web: Sports Viz Sunday
X: #SportsVizSunday
Real World Fake Data
Create business dashboards using provided data sets for various industries and departments.
Web: Real World Fake Data
X: #RWFD
2024 - Admin Insights
Data Plus Music
A monthly project visualizing the data behind the music we love!
Web: Data Plus Music
X: #DataPlusMusic
Histórias relacionadas

DataFam Roundup: May 12-16, 2025

DataFam Roundup: May 5-9, 2025

Iron Viz 2025: Where Data Took Flight
 6 Maio, 2025
Subscribe to our blog
Receba em sua caixa de entrada as atualizações mais recentes do Tableau.