DataFam Roundup: November 7-11, 2022
Welcome! Dig into this week's DataFam Roundup—a weekly blog that brings together community content all in one post. As always, we invite you to send us your content—and the DataFam content from your peers that have inspired you! Find the content submission form here.
DataFam content
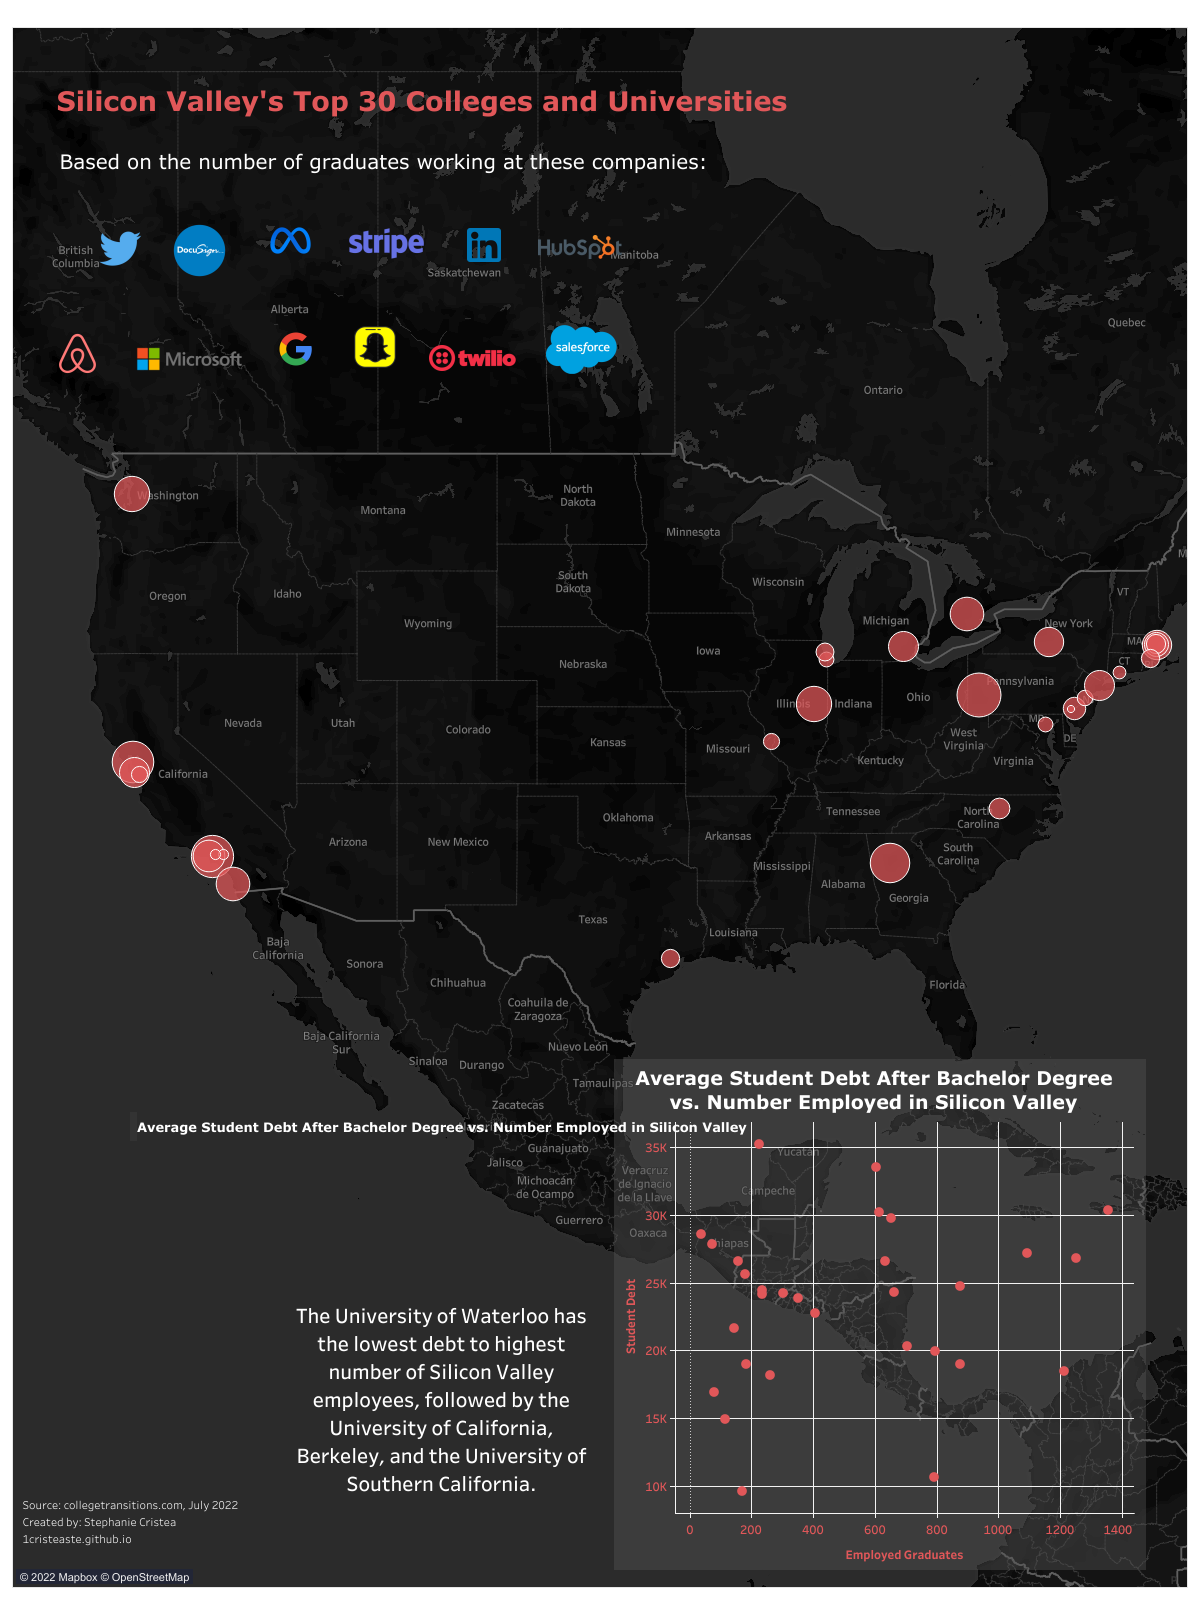
Stephanie Cristea, Visual Capitalist: Visualized: The Top Feeder Schools into Silicon Valley
Dive into content created by the Tableau Community:
-
Kevin Flerlage, The Flerlage Twins: A Solution to the Hex Map Filtering Issue
-
Katie Whyatt, The Atlantic: I don't want anyone to feel there isn't someone in their corner - that's my passion
-
Nicole Lillian Mark, SELECT * FROM data;: Meet the Datafam #3: John Whitmer
-
Zach Bowder: Data + Love, Tableau Visionary Neil Richards
-
Yeo Jun Yan: Hide the Table, How to Create Nested Circles (Onion Chart) in Tableau - My Way
-
Eva Murray: Data Leadership Collaborative, Five Organizational Impacts of a Strong Data Community
-
The Data Coffee Break Podcast: What you didn't expect from NLP with Martin Staniforth
-
Shahid Sheikh, VizArtPandey Customize How Your Map Looks in Tableau?
-
Jared Flores, Put Some Prep In Your Step: Youtube Dashboard Pt. 1 - Python and APIs: Put Some Prep In Your Step
-
Dan Bunker: Playfair Data, The Beginner’s Guide to Tableau Table Calculations
-
Amir Meimand, VizConnect: Tableau Table Extensions
-
Kimly Scott, she will viz: Personal Vizzing & Community Projects with Jessica Moon
-
Stephanie Cristea, Visual Capitalist: Visualized: The Top Feeder Schools into Silicon Valley
-
Jim Dehner: If's, And's, Cases and In's Logical Operator's – How to's
Team Tableau
Upcoming events and community participation
-
Nominations are OPEN for the 2022 Data Literacy Awards! | Data Literacy It's that time of year again! We'd like your help identifying the individuals and content that helped to advance Data Literacy the most this past year.
-
Tableau Tips for Tomorrow's Leaders Join this virtual event to hear from Tableau community Ambassadors as they share their favorite Tableau Tips, learn helpful hidden gems and secret hacks you probably haven't seen before, and support our vision and building for the next generation.
-
Women in Dataviz is moving from Discord to Slack. Join here.
-
What does it mean to be a Data Leader? Join this Data Leadership Collaborative (DLC) Roundtable to learn what it means to be a Data Leader from three community members.
-
Iron Viz Feedback Initiative 2023: Book a 15-minute feedback session with Tableau community members and prior Iron Viz contestants who will review your viz and share feedback on your Iron Viz entry.
-
Storytelling With Data - London Workshop: Join Cole and members of the team in London to learn about visualization and data storytelling best practices in an engaging, hands-on in-person session!
Vizzes
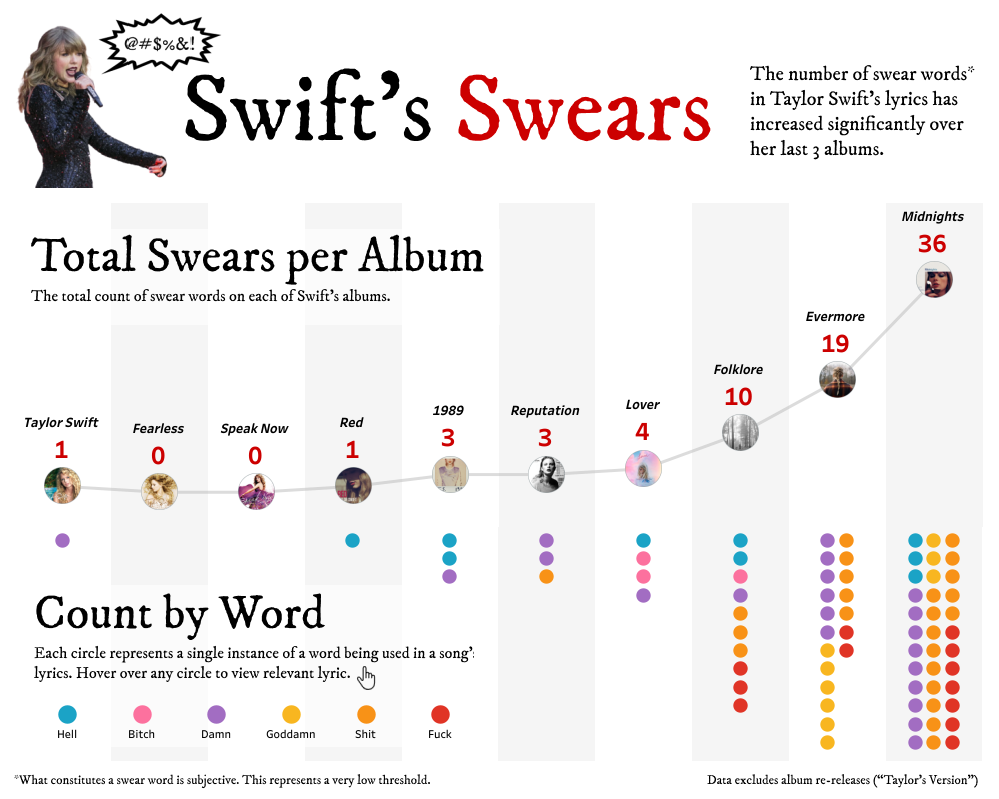
Karl Ericson: Swift's Swears
See the latest Viz of the Day, trending vizzes, featured authors, and more on Tableau Public.
Check out some inspirational vizzes created by the community:
- Karl Ericson: Swift's Swears
- Mark: Kidney Transplants Dashboard
- Gbolahan Adebayo: Who Americans Spend Their Time With (MoM Week #45)
-
Nicole Mark: The staggering loss of human life during Russia's invasion of Ukraine | #30DayMapChallenge Day 5 - Ukraine
Community Projects
Back 2 Viz Basics
A bi-weekly project helping those who are newer in the community and just starting out with Tableau. Not limited just to newbies!
Web: Back 2 Viz Basics
Twitter: #B2VB
Week 22: Design a Mobile View
Workout Wednesday
Build your skills with a weekly challenge to re-create an interactive data visualization.
Web: Workout Wednesday
Twitter: #WOW2022
Week 45: Average Patient Waittimes
Makeover Monday
A weekly social data project.
Web: Makeover Monday
Twitter: #MakeoverMonday
Week 45: Who do we spend time with across our lifetimes?
Preppin' Data
A weekly challenge to help you learn to prepare data and use Tableau Prep.
Web: Preppin’ Data
Twitter: #PreppinData
Week 45: Strange Table Structure
DataFam Con
A monthly challenge covering pop culture and fandoms.
Web: DataFam Con
Twitter: #DataFamCon
October 2022: Stranger Things + Music Nostalgia Month
EduVizzers
A monthly project connecting real education data with real people.
Web: Eduvizzers
November 2022: Student Loan Borrowing and Repayment
Games Night Viz
A monthly project focusing on using data from your favorite games.
Web: Games Nights Viz
Twitter: #GamesNightViz
October 2022: IronViz Edition: Tips from the Team
Iron Quest
Practice data sourcing, preparation, and visualization skills in a themed monthly challenge.
Web: Iron Quest
Twitter: #IronQuest
August 2022: The Tour: The Sound of Games with #DataPlusMusic
Public Policy Viz
Bridging the gap between analytics professionals and policy practitioners.
Web: Public Policy Viz
Twitter: #PublicPolicyViz
Project 1: Redlining in Pittsburgh, PA
Data Plus Music
A monthly project visualizing the data behind the music we love!
Web: Data Plus Music
Twitter: #DataPlusMusic
July 2022: The Intro
Storytelling with Data
Practice data visualization and storytelling skills by participating in monthly challenges and exercises.
Web: Storytelling with Data
Twitter: #SWDChallenge
November 2022: comedic charts
Project Health Viz
Uncover new stories by visualizing healthcare data sets provided each month.
Web: Project Health Viz
Twitter: #ProjectHealthViz
August 2022: Mental Health Care Professionals Shortages
Diversity in Data
An initiative centered around diversity, equity & awareness by visualizing provided datasets each month.
Web: Diversity in Data
Twitter: #DiversityinData
September 2022: Global Women
Sports Viz Sunday
Create and share data visualizations using rich, sports-themed data sets in a monthly challenge.
Web: Sports Viz Sunday
Twitter: #SportsVizSunday
October 2022: Row, row, row your boat
Viz for Social Good
Volunteer to design data visualizations that help nonprofits harness the power of data for social change.
Web: Viz for Social Good
Twitter: #VizforSocialGood
Sept 2-Sept 30 2022: India Water Portal/Arghyam
Real World Fake Data
Create business dashboards using provided data sets for various industries and departments.
Web: Real World Fake Data
Twitter: #RWFD
Session 3: Community Service Requests
SDG Viz Project
Visualize data about Sustainable Development Goals provided by the World Health Organization.
Web: SDG Viz Project
Twitter: #TheSDGVizProject
Histórias relacionadas
Subscribe to our blog
Receba em sua caixa de entrada as atualizações mais recentes do Tableau.


