DataFam Roundup: March 17-21, 2025


Welcome! Dig into this week's DataFam Roundup—a weekly blog that brings together community content all in one post. As always, we invite you to send us your content—and the DataFam content from your peers that have inspired you! Find the content submission form here.
Community Highlight
To recognize new and consistent Tableau contributors—we’re excited to have a section within the weekly DataFam Roundup called the Tableau Community Highlight. Find out how to get involved.

Toludoyin Shopein, Analytics Engineer
Nigeria
Toludoyin Shopein is an Analytics Engineer. Her first encounter with Tableau was during an online analytics course that she took. While exploring the tool, she came across the Tableau Public profile of a creator whose work inspired her, showing her how Tableau could be used to build intuitive, yet creative dashboards. That initial inspiration led her to discovering other creators in the Tableau community whose pages she found herself frequently visiting to learn and explore new techniques. Toludoyin also used resources like blogs, YouTube videos, and community projects to strengthen her Tableau skills.
Now, Toludoyin is active on Tableau Public, creating vizzes on social and economic topics and participating in community projects. She appreciates the incredible support that the Tableau community offers, the knowledge sharing, feedback, and inspiration from fellow creators have been invaluable for her. To give back, Toludoyin shares her knowledge and work on social media platforms, and she is also looking forward to engaging with more of the DataFam in person at Tableau Conference 2025.
Connect with Toudoyin on LinkedIn, Tableau Public, and X.
DataFam Content
Dive into content created by the Tableau Community:
- David Chater: Tableau Semantic Data Models - first look
- Adam Mico:
- Data + Love: Conference Prep, Data Devs, and Complex Feels with Kyle Massey
- The Flerlage Twins and Kasia Gąsiewska-Holc: Build a Feedback Tool Into Your Tableau Workbook!!
- Dub Dub Data: D09 Tableau Glow Ups: Design That Delivers Clarity & Adoption
- Louis Yu: Epi 58: Van Gogh in 37 Self-Portraits
- Elisa Davis: Beyond the Build: How Iron Viz Can Level Up Your Presentation Skills
- Johan de Groot: Extract custom shapes from Tableau workbook
- Data2Vizuals: Violin Chart 'Build Along': MoM 2025 WK 3
- Steve Adams:
- Deepak Holla: Understanding Clusters in Tableau Desktop
- Andy Kriebel: How to Analyze Customer Retention with a Jump Plot
Team Tableau Content
- Tableau 2025.1 is now available!
- The Agenda Builder for Tableau Conference #TC25 is live!
- Personalize your conference experience by adding sessions to your schedule. New to TC this year, attendees can reserve seats in session types including breakouts, hands-on trainings, and roundtables.
- Inside Track on Tableau Conference 2025
Upcoming events and community participation
Visualizations
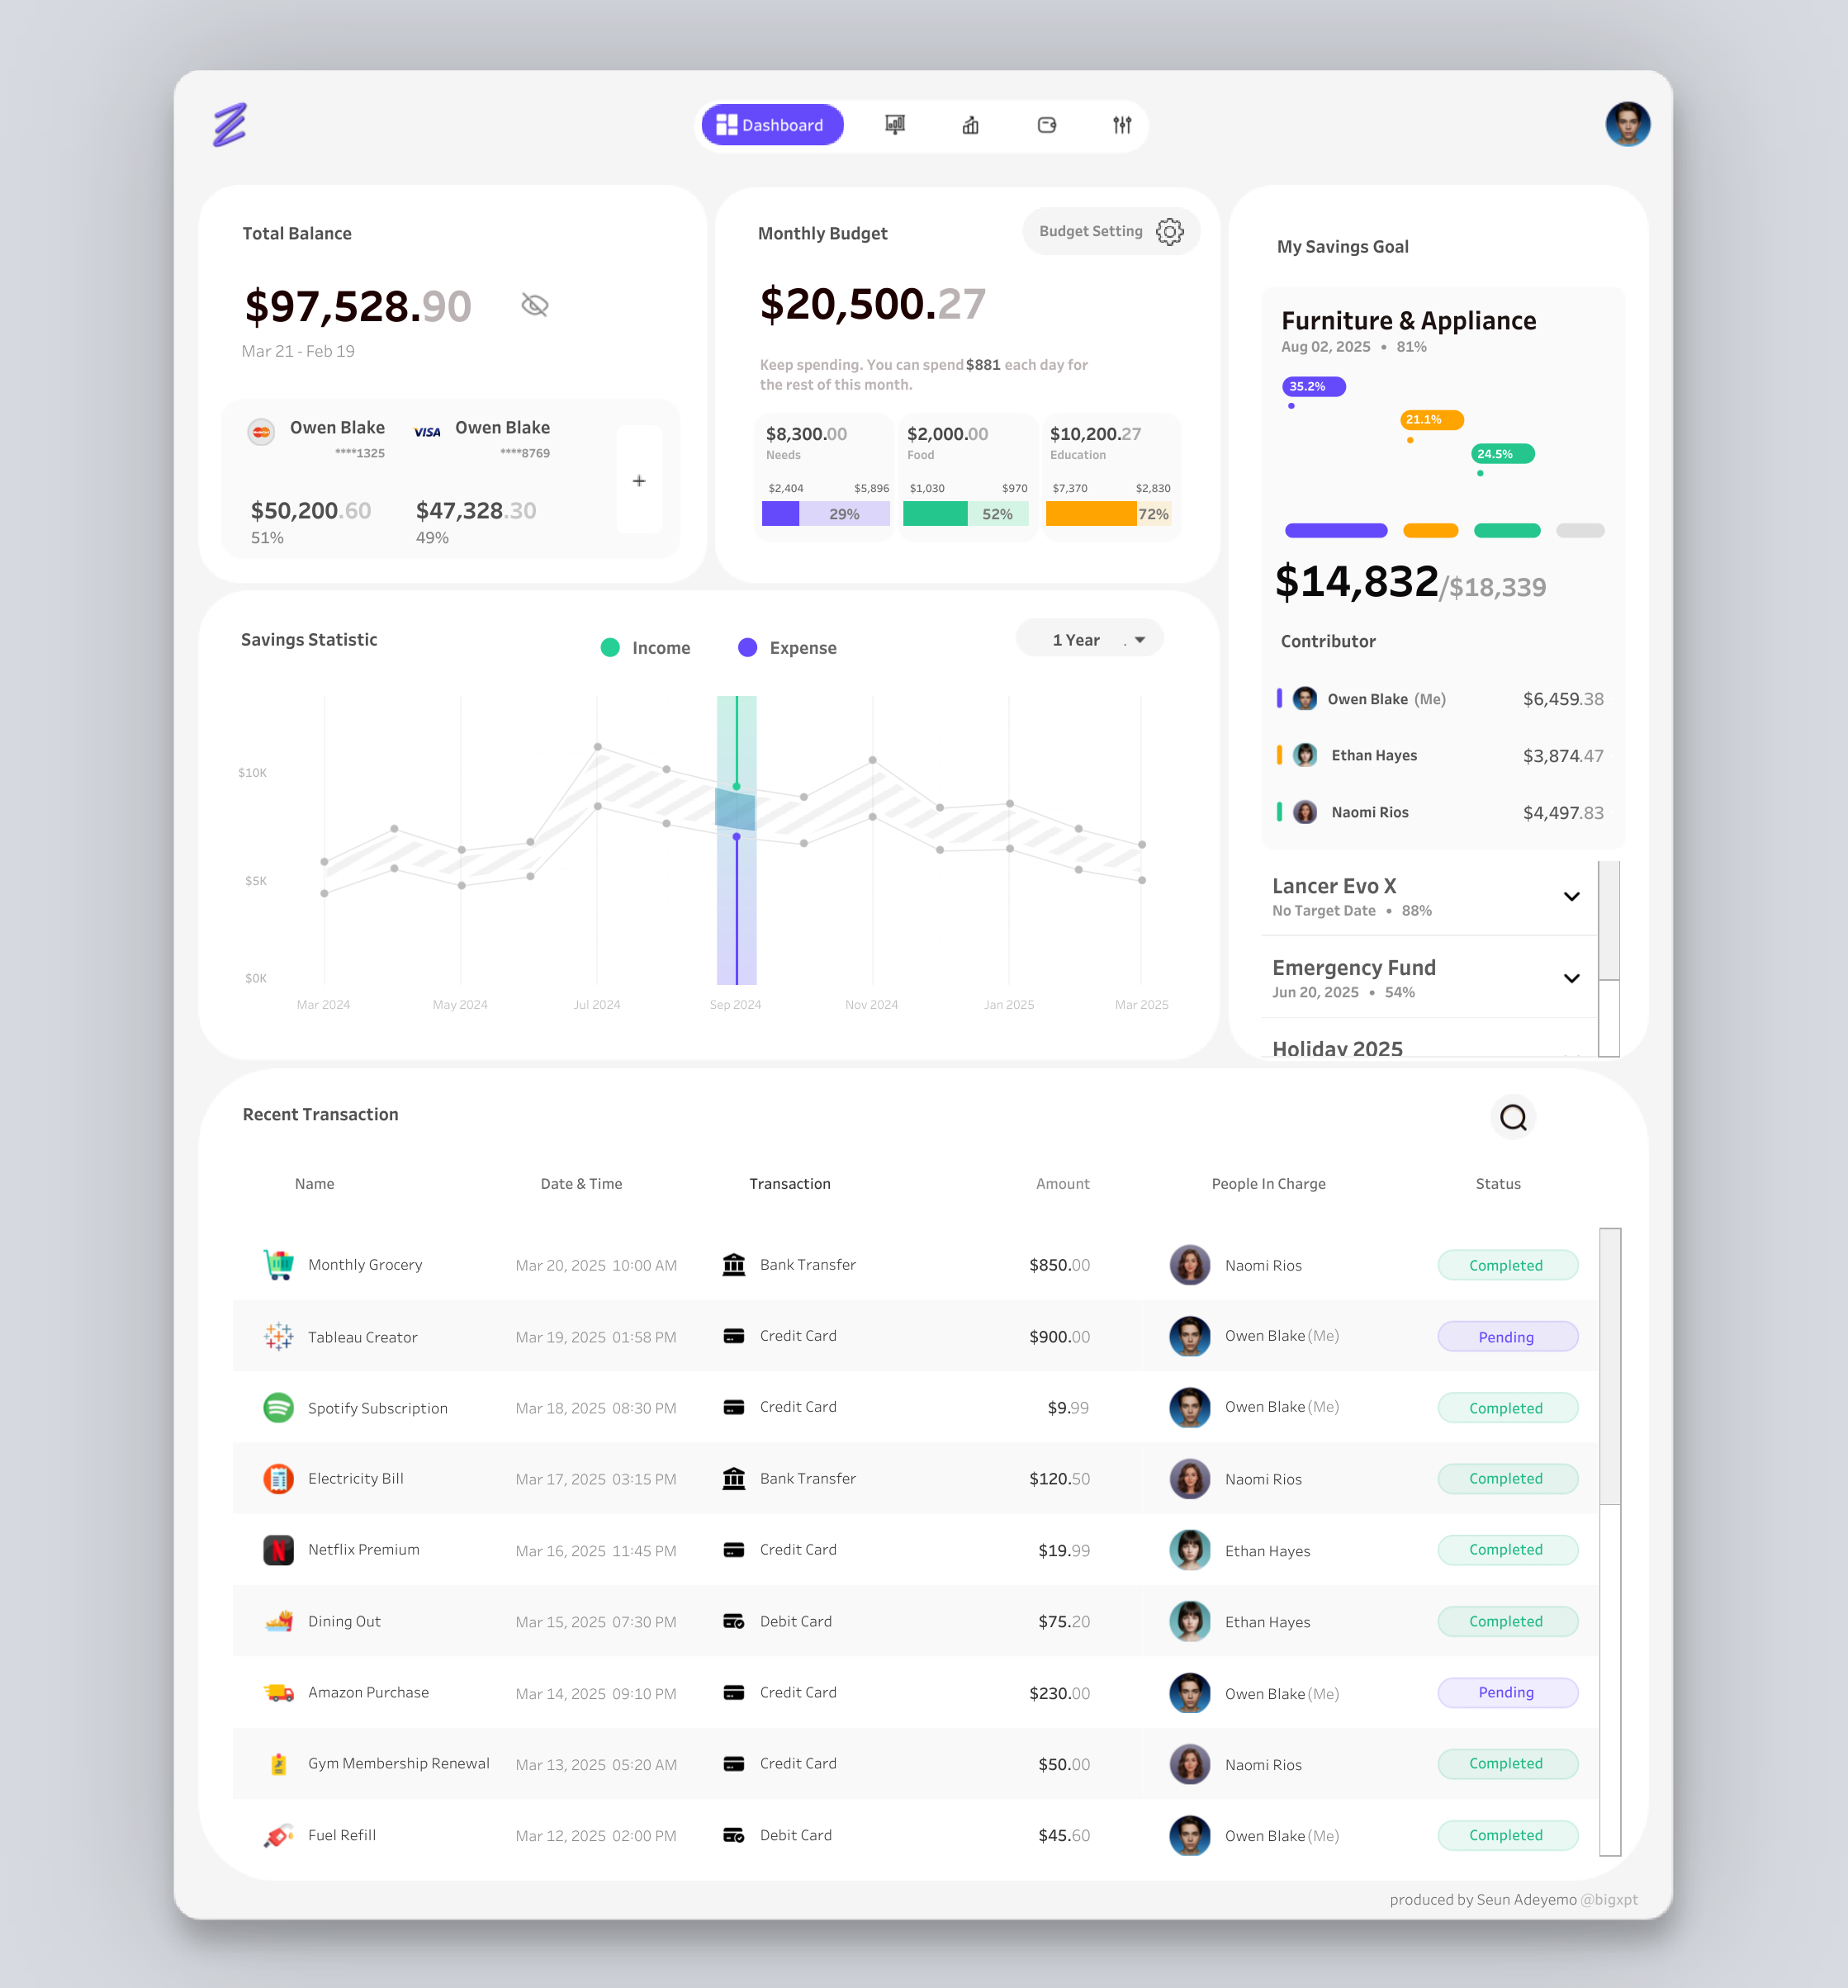
Seun Adeyemo: PERSONAL FINANCE
See the latest Viz of the Day, trending vizzes, featured authors, and more on Tableau Public.
Check out some inspirational vizzes created by the community:
- Adeyemo Oluwafemi John: Investment-Portfolio
- Whitney Wood: Pokémon GO - Revenue by Region
- Shangruff Raina
- Deepak Holla: 3 Possible Ways to Visualize Deviation in Tableau
Community Projects
Back 2 Viz Basics
A bi-weekly project helping those who are newer in the community and just starting out with Tableau. Not limited just to newbies!
Web: Back 2 Viz Basics
X: #B2VB
Workout Wednesday
Build your skills with a weekly challenge to re-create an interactive data visualization.
Web: Workout Wednesday
X: #WOW2022
Preppin' Data
A weekly challenge to help you learn to prepare data and use Tableau Prep.
Web: Preppin’ Data
X: #PreppinData
Makeover Monday
Create business dashboards using provided data sets for various industries and departments.
Web: Makeover Monday
X: #MakeoverMonday
Visual Climate
Collaborate and share climate data.
Web: Visual Climate
X: #VisualClimate
DataFam Con
A monthly challenge covering pop culture and fandoms.
Web: DataFam Con
X: #DataFamCon
EduVizzers
A monthly project connecting real education data with real people.
Web: Eduvizzers
Viz for Social Good
Volunteer to design data visualizations that help nonprofits harness the power of data for social change.
Web: Viz for Social Good
X: #VizforSocialGood
Games Night Viz
A monthly project focusing on using data from your favorite games.
Web: Games Nights Viz
X: #GamesNightViz
Iron Quest
Practice data sourcing, preparation, and visualization skills in a themed monthly challenge.
Web: Iron Quest
X: #IronQuest
Storytelling with Data
Practice data visualization and storytelling skills by participating in monthly challenges and exercises.
Web: Storytelling with Data
X: #SWDChallenge
Project Health Viz
Uncover new stories by visualizing healthcare data sets provided each month.
Web: Project Health Viz
X: #ProjectHealthViz
Diversity in Data
An initiative centered around diversity, equity & awareness by visualizing provided datasets each month.
Web: Diversity in Data
X: #DiversityinData
Sports Viz Sunday
Create and share data visualizations using rich, sports-themed data sets in a monthly challenge.
Web: Sports Viz Sunday
X: #SportsVizSunday
Real World Fake Data
Create business dashboards using provided data sets for various industries and departments.
Web: Real World Fake Data
X: #RWFD
Data Plus Music
A monthly project visualizing the data behind the music we love!
Web: Data Plus Music
X: #DataPlusMusic
Histórias relacionadas

DataFam Roundup: April 21-25, 2025

DataFam Roundup: April 7-11, 2025

DataFam Roundup: March 31-April 4, 2025
Subscribe to our blog
Receba em sua caixa de entrada as atualizações mais recentes do Tableau.