All hands on data: Extend your analytics with web authoring
“I just don't want to be one of those guys that's in his office until twelve o'clock at night worrying about the WENUS.”
- Chandler Bing
When Chandler’s regional managers have further questions on the WENUS, he stays late to run custom reports. If they want to know how their region is performing and how their team’s numbers compare to last month’s, they call up Chandler. Sound familiar?
Chandler may be a distant memory from the ‘90s, but his late nights at the office are all too familiar. Static reports and endless change requests are today alive and well in many organizations.
How does the modern-day Chandler—or, more importantly, how do you—empower everyone with customized analytics without toiling away at the office late into the night? Not everyone can, or should, have access to your organization’s raw data. If Chandler gave his regional managers access to the WENUS data, he’d have his hands full providing IT support and chasing down misleading dashboards.
It’s a self-service environment Chandler is looking for, one in which the right people can edit and author analytics, without Chandler ever losing control of his data. Allowing people to edit his dashboards and reports empowers them to answer their own questions, while he relaxes with Friends at home.
At Tableau, we call this web authoring. You publish sanctioned dashboards to Tableau Online or Tableau Server and enable your viewers to edit the visualizations right from their browser. And with Tableau 10.1, web authoring just got even better, allowing your regional managers to do even more on the web.
Does Chandler’s story ring true to your struggles? We want to share how web authoring can save you quite a few late nights at the office responding to requests for endless report revisions.
Ask additional questions on top of existing dashboards
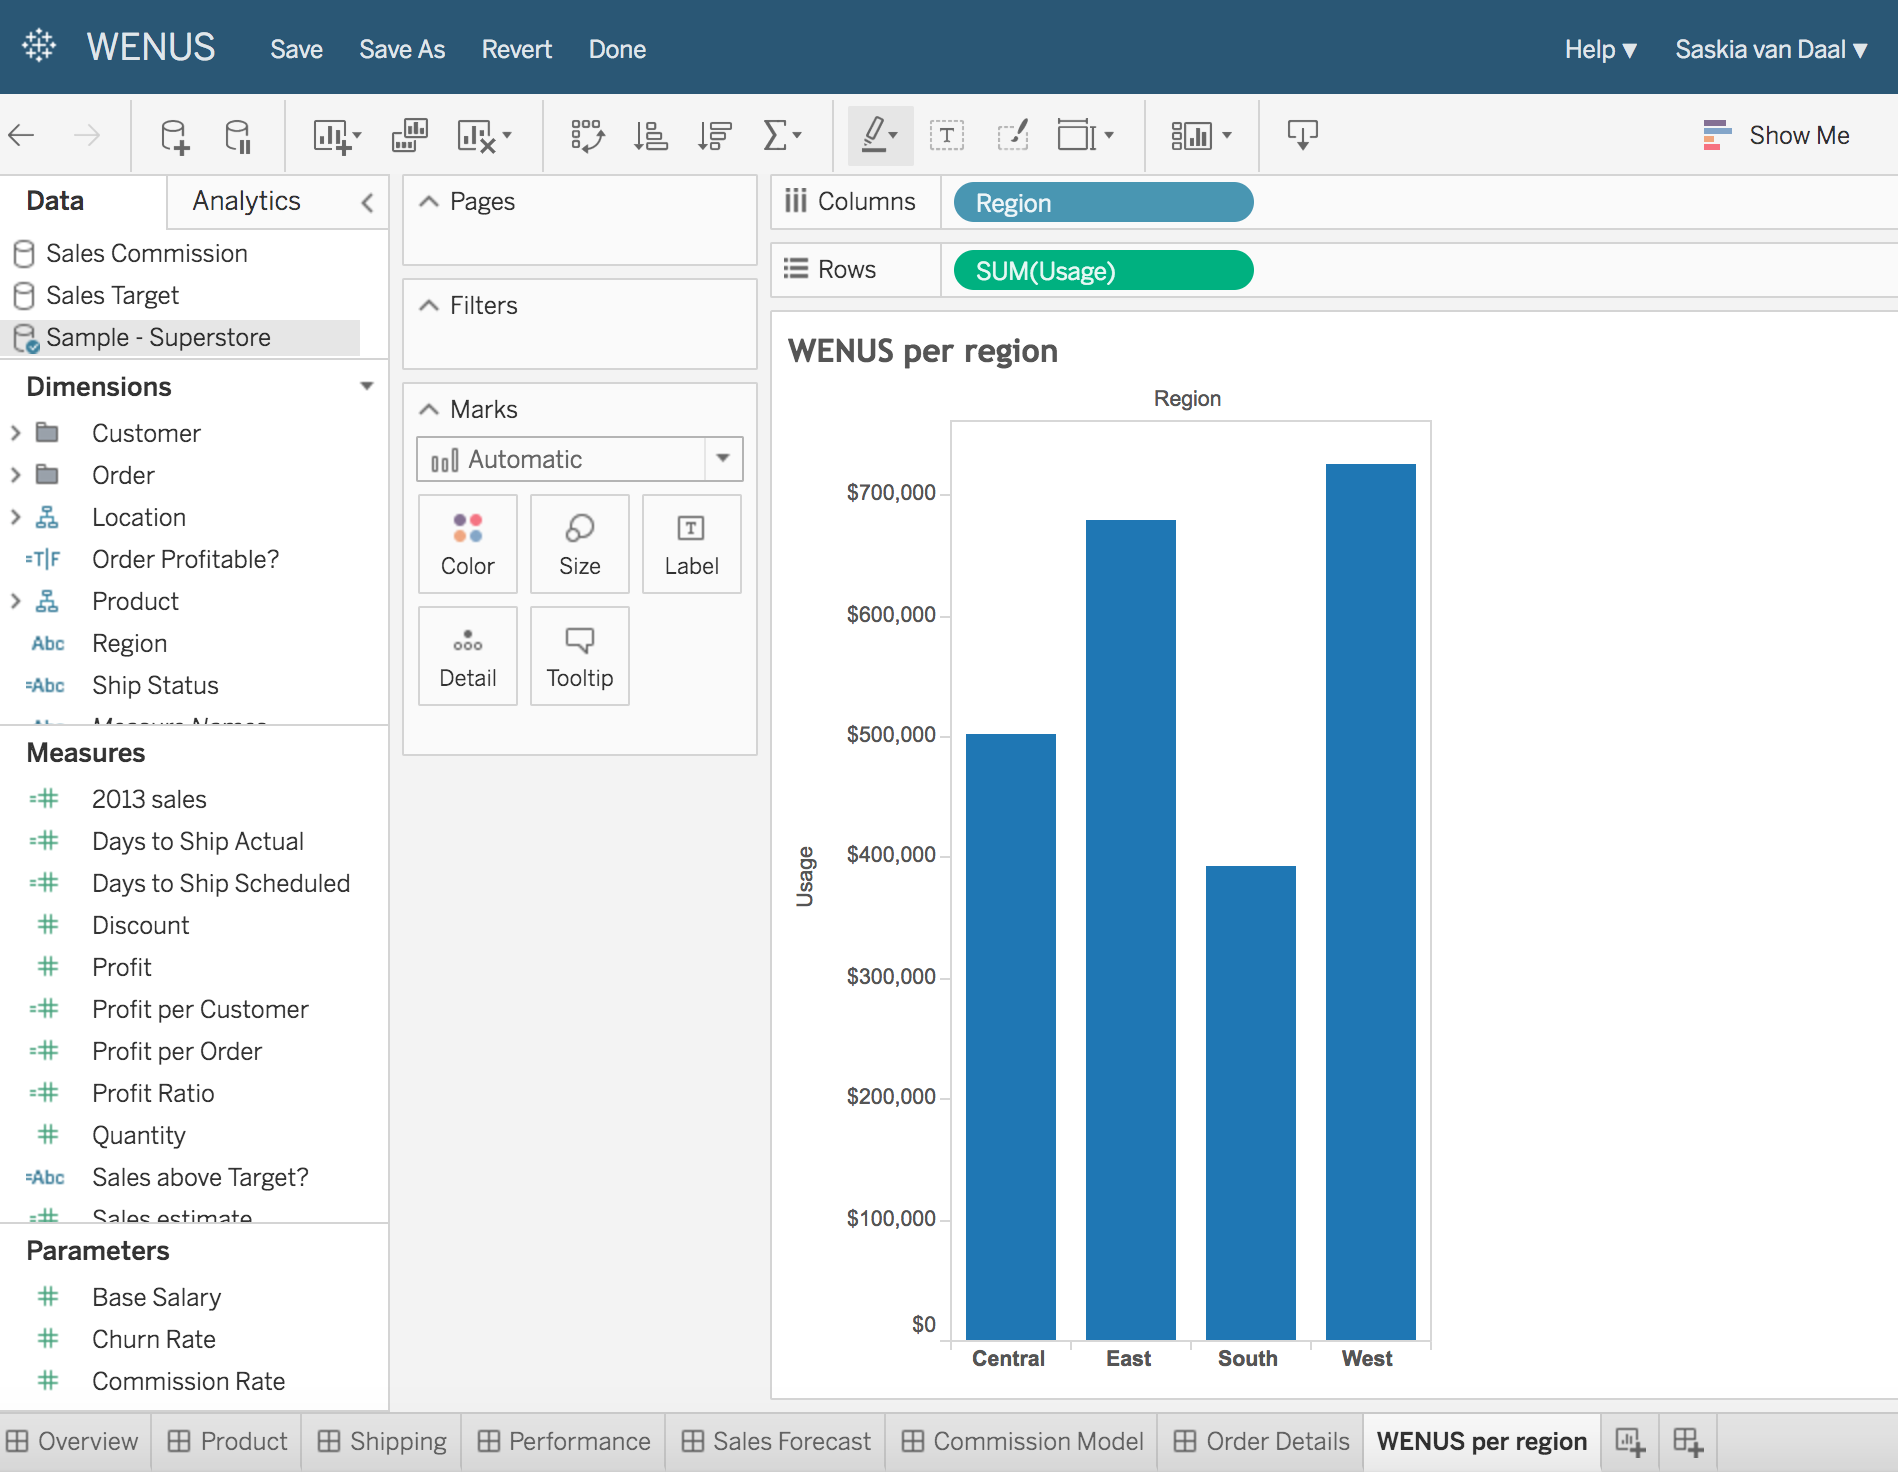
Imagine it now. Your regional managers use web authoring to customize their pre-built WENUS views. They pull customer data into the view, place a profit calculation on the map, and answer new questions as they come—all without submitting a change request. How?
With the right permissions, they’ll see an Edit option in the menu above the dashboard. Once selecting Edit, users will enter a web-editing interface that looks similar to Tableau Desktop. Here they can create new sheets and dashboards based on the data sources connected to the workbook. They can even add completely new data sources if they’ve been published to Tableau Server.
You can control what happens with the new content they create while web-editing. "Save as" permissions lets users save their changes to a new workbook, or let them overwrite the original by granting Save permissions. Just note that for both these options, your users will need publisher site roles.

Create brand new analyses from published data sources
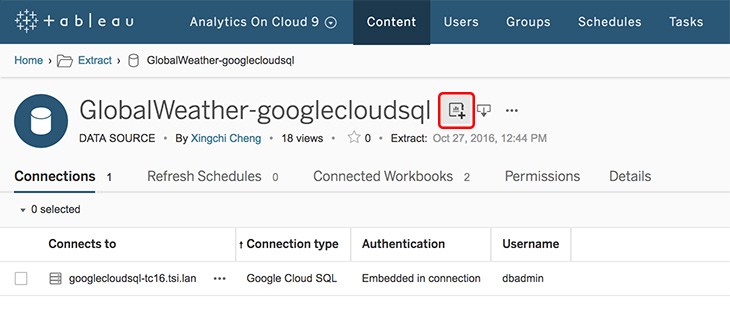
Editing on the fly is helpful. But Chandler doesn’t even need to give his regional managers a prebuilt workbook. If the managers have access to published data sources, they can select the workbook icon (below) and create a brand new workbook from scratch. You can create a published data source by connecting to data in Tableau Desktop and publishing it to Tableau Server or Tableau Online.
Publishing data sources means that other people can access the data and any additional logic you’ve created such as calculations, hierarchies, or groups. It’s a great way to enable more people to do their own analytics, even if they don’t have intimate knowledge of the underlying database systems. A good approach is to then collect feedback from users and provide more advanced data, such as joined or unioned data from multiple databases.

Sure, the TV show Friends in fictional. But scaling analytics across the organization doesn’t have to be fiction. If you’re already using Tableau Server or Tableau Online, you can get started in just a few minutes (or start a free trial).
What does this look like in real life?
Consider Oldcastle, a leading manufacturer of building products in North America. Employees have access to interactive pre-built dashboards as well as templates that are pre-connected to data. Anyone can conduct their own secure analysis using web authoring. People who can realize the full impact of the insights can easily explore the data and drive decisions.
Web authoring can also add a lot of value to external customers. With this feature, David Pires at CACI enables clients to interact with data in different ways. Clients have access to dashboards that answer common questions. David also makes curated data sources available so analysts in his customers’ teams can perform deeper analysis. CACI makes all of this available through a customer portal by embedding Tableau workbooks. This way, customers have all of the relevant information in one place.
with Tableau's enterprise analytics platform, you have many options for sharing and collaborating. Check out the full details on our sharing page.
Tableau Online 10.2 enhancements
Tableau Online 10.2, currently in beta, includes enhancements to web authoring that make your work even faster and easier. Check out the details in this blog post and sign up for Tableau’s beta program. If you’re new to Tableau Online, start a free trial in seconds and start sharing data, dashboards, and insights today.And visit our Coming Soon page to learn about all the features we're planning for Tableau 10.2.
Tableau Online tips and tricks
Ready to take your skill to the next level? Check out our list of tips and explore in-depth advice from Tableau Online experts on topics ranging from automated data updates to advanced user permissioning and data security.
Histórias relacionadas
Subscribe to our blog
Receba em sua caixa de entrada as atualizações mais recentes do Tableau.


