Tableau brings federal energy development data to life, helping the public understand a key piece of the climate solution

Glacier National Park Credit: Greg Owens
America’s federal lands are home to some of the most spectacular landscapes, from the diverse elevations and lush forest of Washington’s Olympia National Park to the majestic rivers of Idaho’s Clearwater Basin and rugged peaks of Montana’s Glacier National Park.
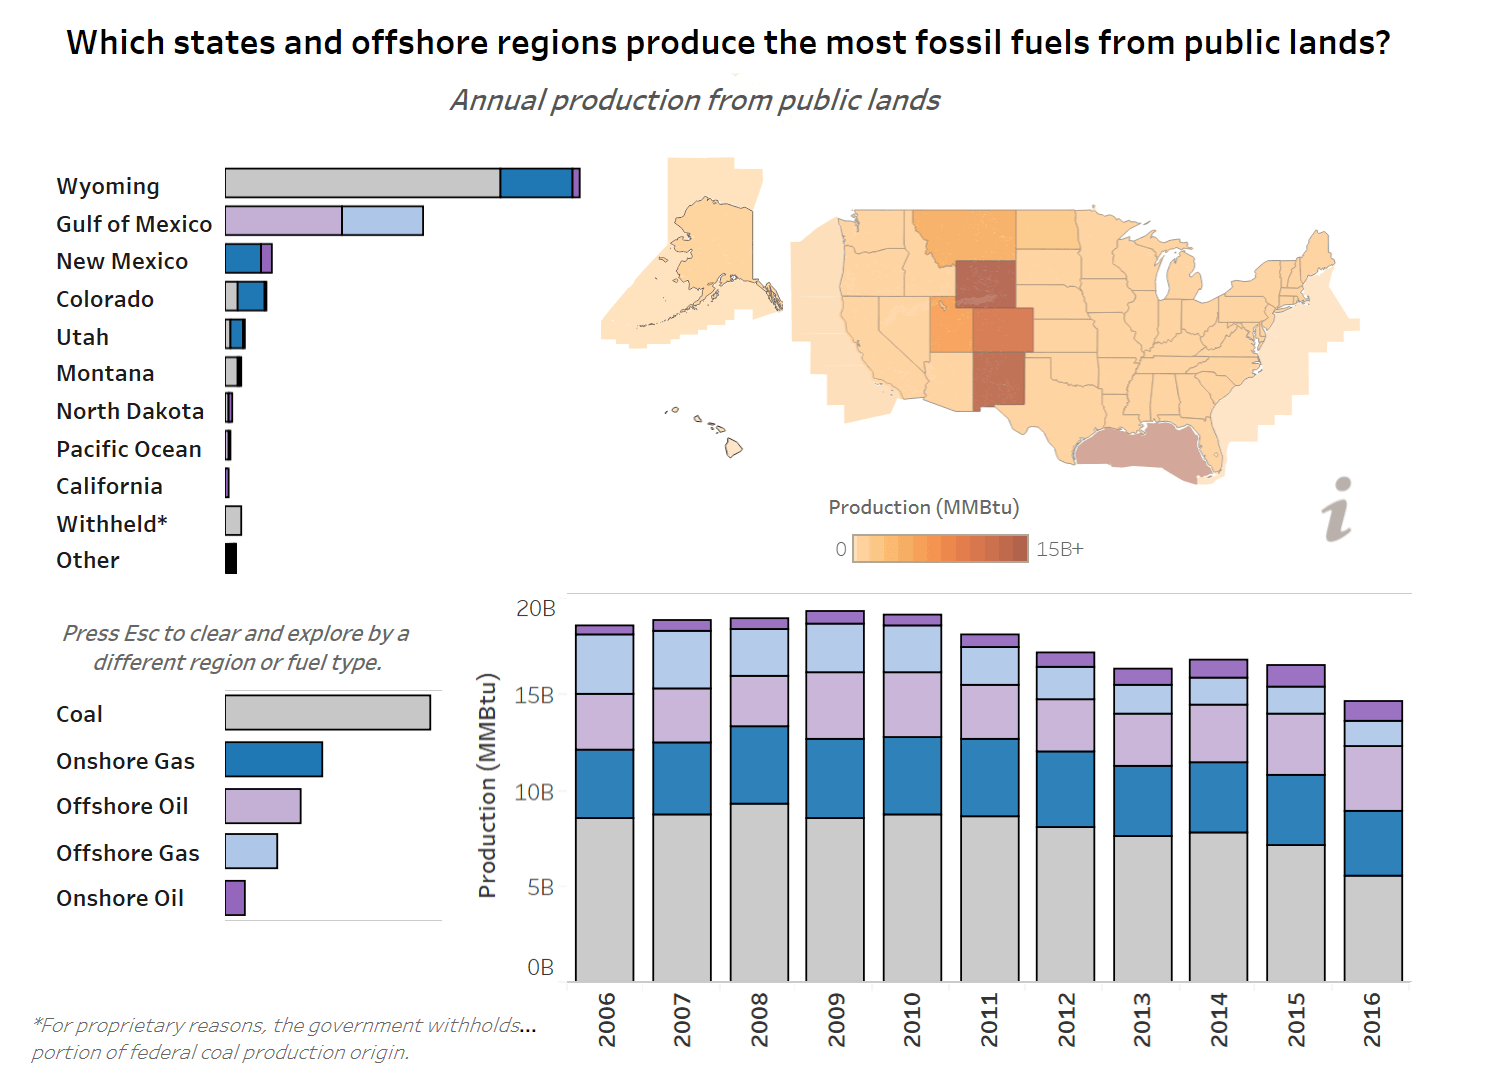
What many don’t know is that a significant amount of America’s energy production occurs on federal lands and waters. Combined, federal lands accounted for 42% of all coal, 22% of all crude oil, and 15% of all natural gas produced in the United States in 2015.
Where there is fossil fuel production, there are emissions. Over the last decade, the lifecycle emissions associated with these publicly-owned fossil fuel resources amounted to approximately 20% of all U.S. greenhouse gas (GHG) emissions.
Despite all of this, the federal government does not have a system in place to track or disclose greenhouse gas emissions from the extraction and production of fossil fuel resources on public lands. Billions of dollars’ worth of coal, oil, and gas comes from public lands, but the government isn’t tracking, let alone managing, the climate consequences.
The Wilderness Society sees an opportunity to both better manage the nation’s energy resources and to reduce GHG emissions, particularly where federal lands are playing a role in climate change. We’re trying to educate reporters, policymakers, and climate activists about this issue. However, locating and understanding data on federal fossil fuel resources and production can be extremely challenging—and that’s where data visualizations are helping us close the gap in understanding.
Interactive visualizations help to explain the role federal lands play in climate change

To help illustrate to the public the hidden impacts of coal, oil, and gas production on federal lands, The Wilderness Society used Tableau to build the Federal Lands Emissions Accountability Tool (FLEAT). FLEAT uses a series of data sets to create interactive pages that look at the magnitude of energy production on federal lands, projected greenhouse gas emissions, and the social cost of carbon. Users can click on the production map and then select individual states and regions to show the level of fossil fuel production in each state over time and how their state compares to others, as well as the country. This interactive visual can help inform legislators as they are making policy decisions and can also illustrate the importance and local impact of these issues to the media.

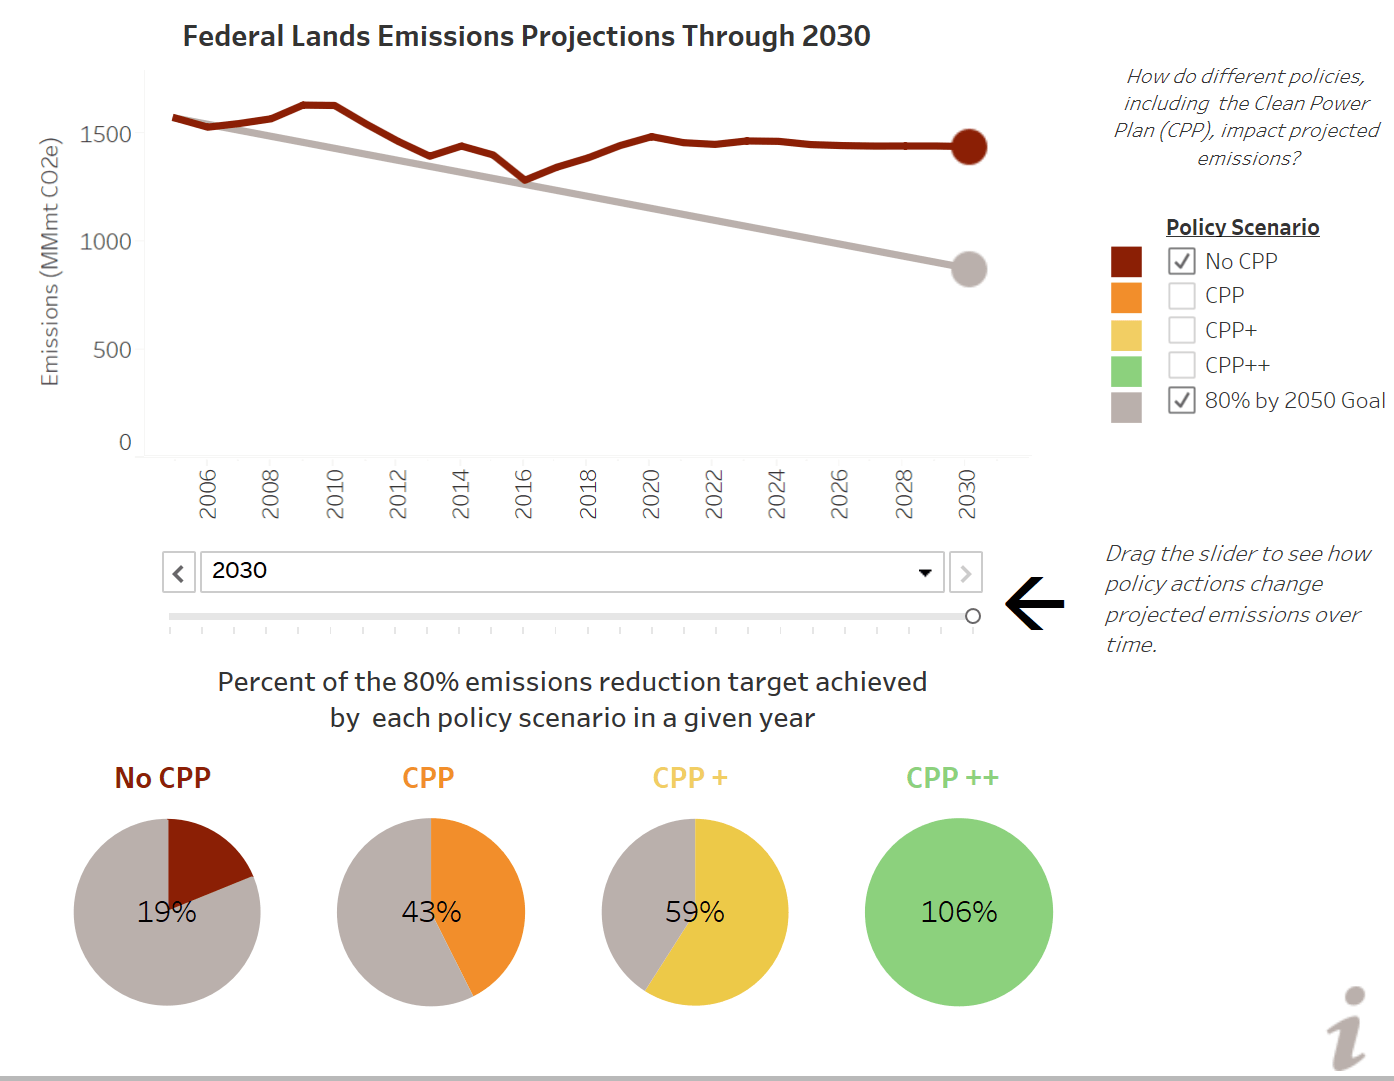
A second interactive dashboard shows the lifecycle emissions from federal lands allowing users to take a closer look at different policy scenarios and their impacts on projected emissions. The grey line represents the 80% reduction target the U.S. set following the Paris Climate Agreement, while the red line is a conservative estimate of where our current policies will take us. The yellow, orange, and green lines represent other policy scenarios ranging from simply implementing the Clean Power Plan to pursuing more aggressive emissions education policies like pricing carbon, increasing royalties, and regulating methane waste.
The emissions projects illustrate that on our current path we are lagging behind international emissions reduction targets as outlined in the Paris Agreement.
Progress begins with visualizing the present situation
While the federal government has yet to make any policy changes on this issue, our ability to visualize lifecycle emissions on federal lands—and to use this information to showcase other related issues—helps us better tell a story that has until now been very challenging to tell. The Wilderness Society is using these visualizations in work with reporters, climate activists, and the public to advocate for a change in federal lands energy management.
FLEAT has caught the attention of several partners, including fellow conservation groups and outdoor apparel companies, who have reached out with interest in working with The Wilderness Society on future projects related to this issue. We are sharing the information with partner groups to help elevate this issue even further, with hopes of eventual legislation to require federal tracking of GHG emissions on federal lands.
Find more information on FLEAT and The Wilderness Society’s work here.
Verwante verhalen
Subscribe to our blog
Ontvang de nieuwste updates van Tableau in je inbox.


