Make your dashboards even more beautiful with Tableau Public 2018.2
Tableau Public 2018.2 is here with functionality that will help you take your dashboards to the next level. The new easy-to-use dashboard formatting tools include automatic mobile layouts, dashboard grids, and transparent quick filters. This release also brings new functionality to mapping in Tableau, including the ability to join datasources when the only common attribute is location using spatial join.
Automatic Mobile Layout
Now it’s even easier to make dashboards mobile friendly. Automatic mobile layout creates a phone and tablet layout from your desktop version by applying mobile best practices. Use these layouts as is, or edit the dashboard to create a customized mobile experience for your dashboard. Here's how to make an automatic mobile layout:
- Select Device Preview
- Select Phone
- Click add phone layout.
For phone layouts, we now place all dashboard elements in a vertical stack. This is a simple layout with spacing that’s appropriate for viewing on a phone. For tablet layouts, we now default to fit all spacing so your entire dashboard fits on the screen.

Dashboard Grid
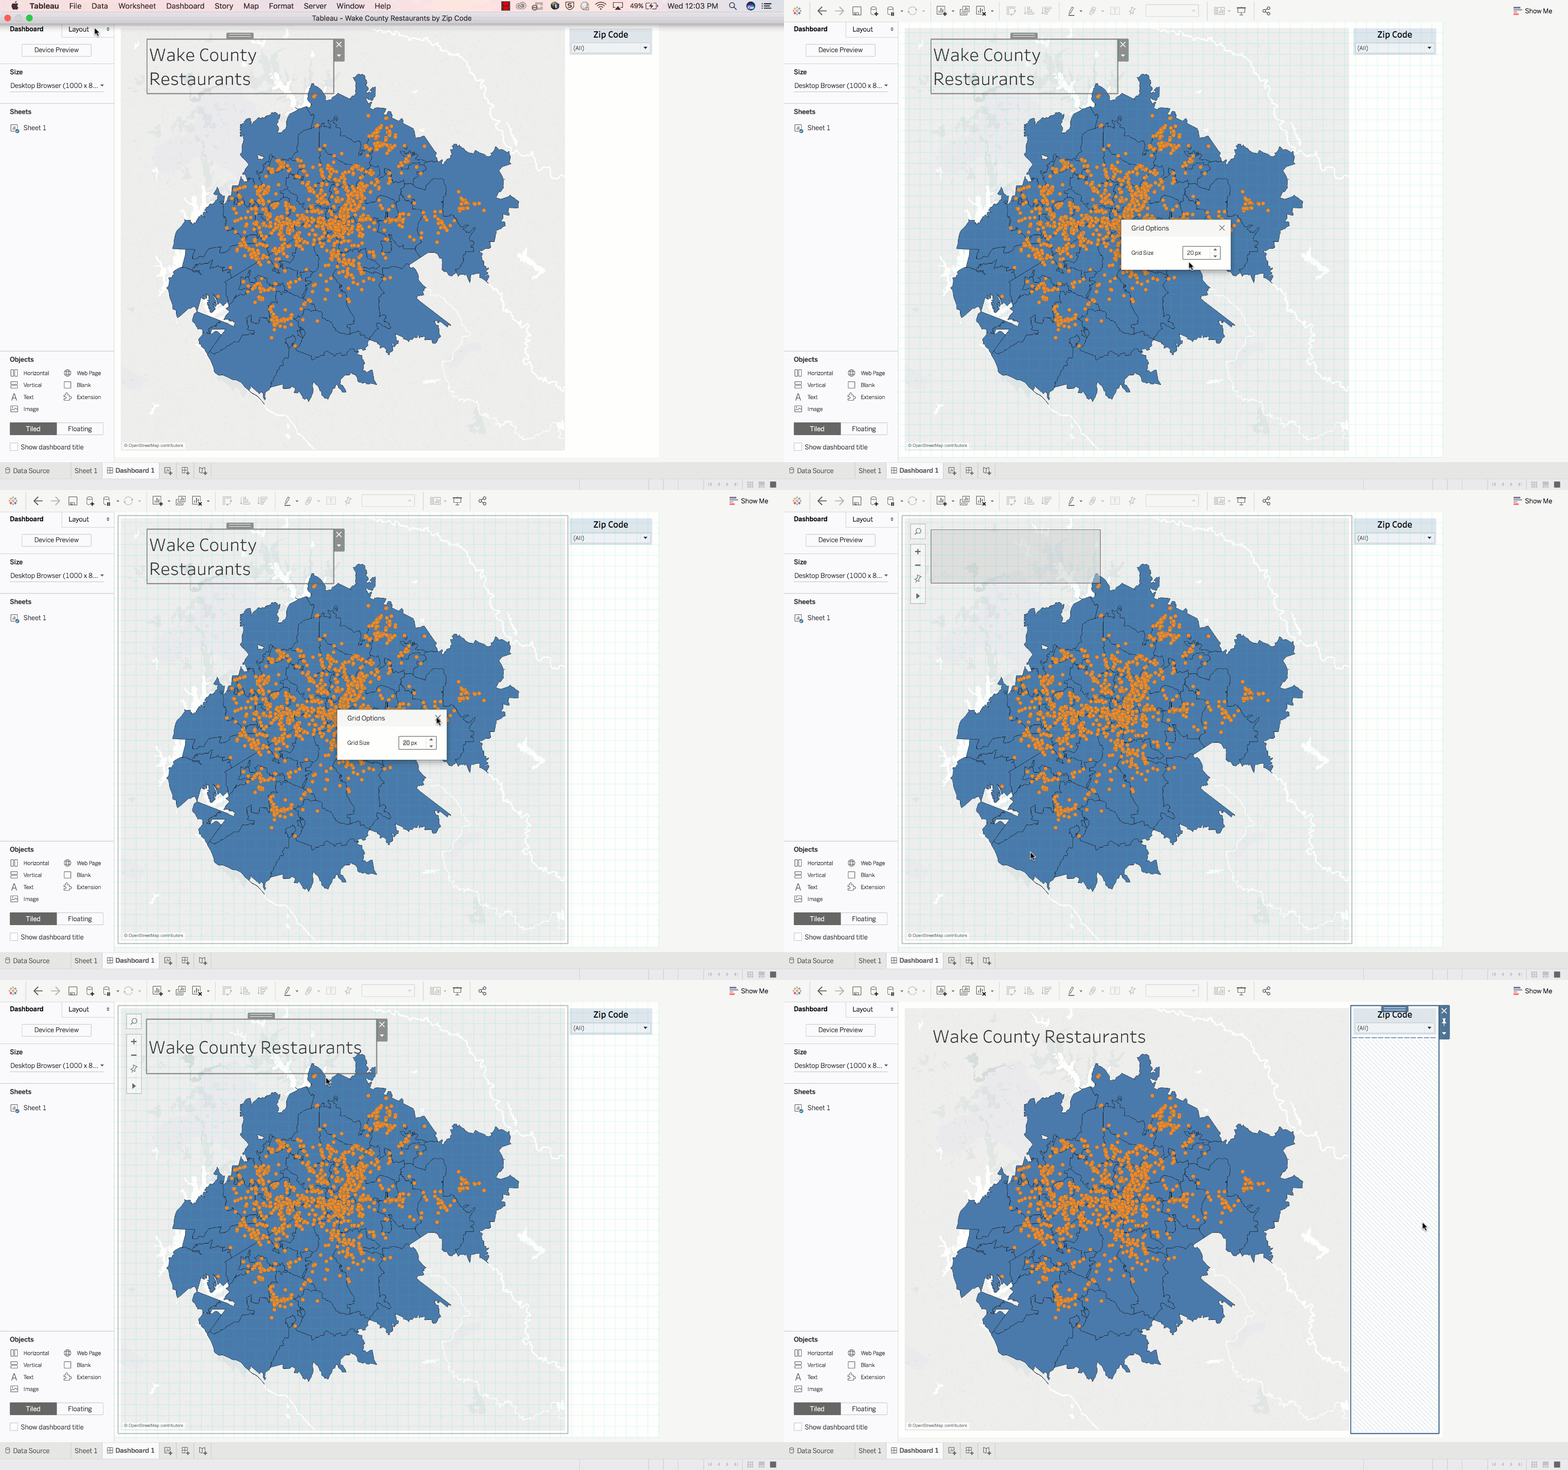
You now precisely control your dashboard elements with grid formatting. With grid lines, you can see a grid overlay above a dashboard and use keyboard arrows to move and resize floating elements pixel by pixel. To help with better visual alignment, you can even see a preview of dashboards elements when moving their position. Here are some tips to help you perfect your design in minutes:
Toggle the grid overlay on and off
- You can set grid visibility (on/off) and cell size per per dashboard basis
- Toggle grid overlay on/off via Dashboard > Show Grid menu
- Grid is set to 20 pixel cell size by default
- Cell size range: 5 - 1,000 pixels
- Change the grid cell size via Dashboard > Grid Options menu
- Tableau persists your grid settings (size and visibility) for each dashboard in your workbook
Keyboard nudging
- To nudge one pixel at a time, use the arrow keys (up, down, right, left)
- To nudge 10 pixels at a time use the SHIFT + arrow keys
Keyboard resizing
- Use the keyboard to resize the width and height of floating dashboard items
- Resize 1 pixel: ALT + arrow keys
- Resize 10 pixels: ALT + SHIFT + arrow keys
- See a bitmap preview when moving floating dashboard items
Keyboard shortcuts
- Press G to toggle grid overlay on/off
- Press T to toggle between the Dashboard and Layout tabs

Transparent Filters, Highlighters, Parameters
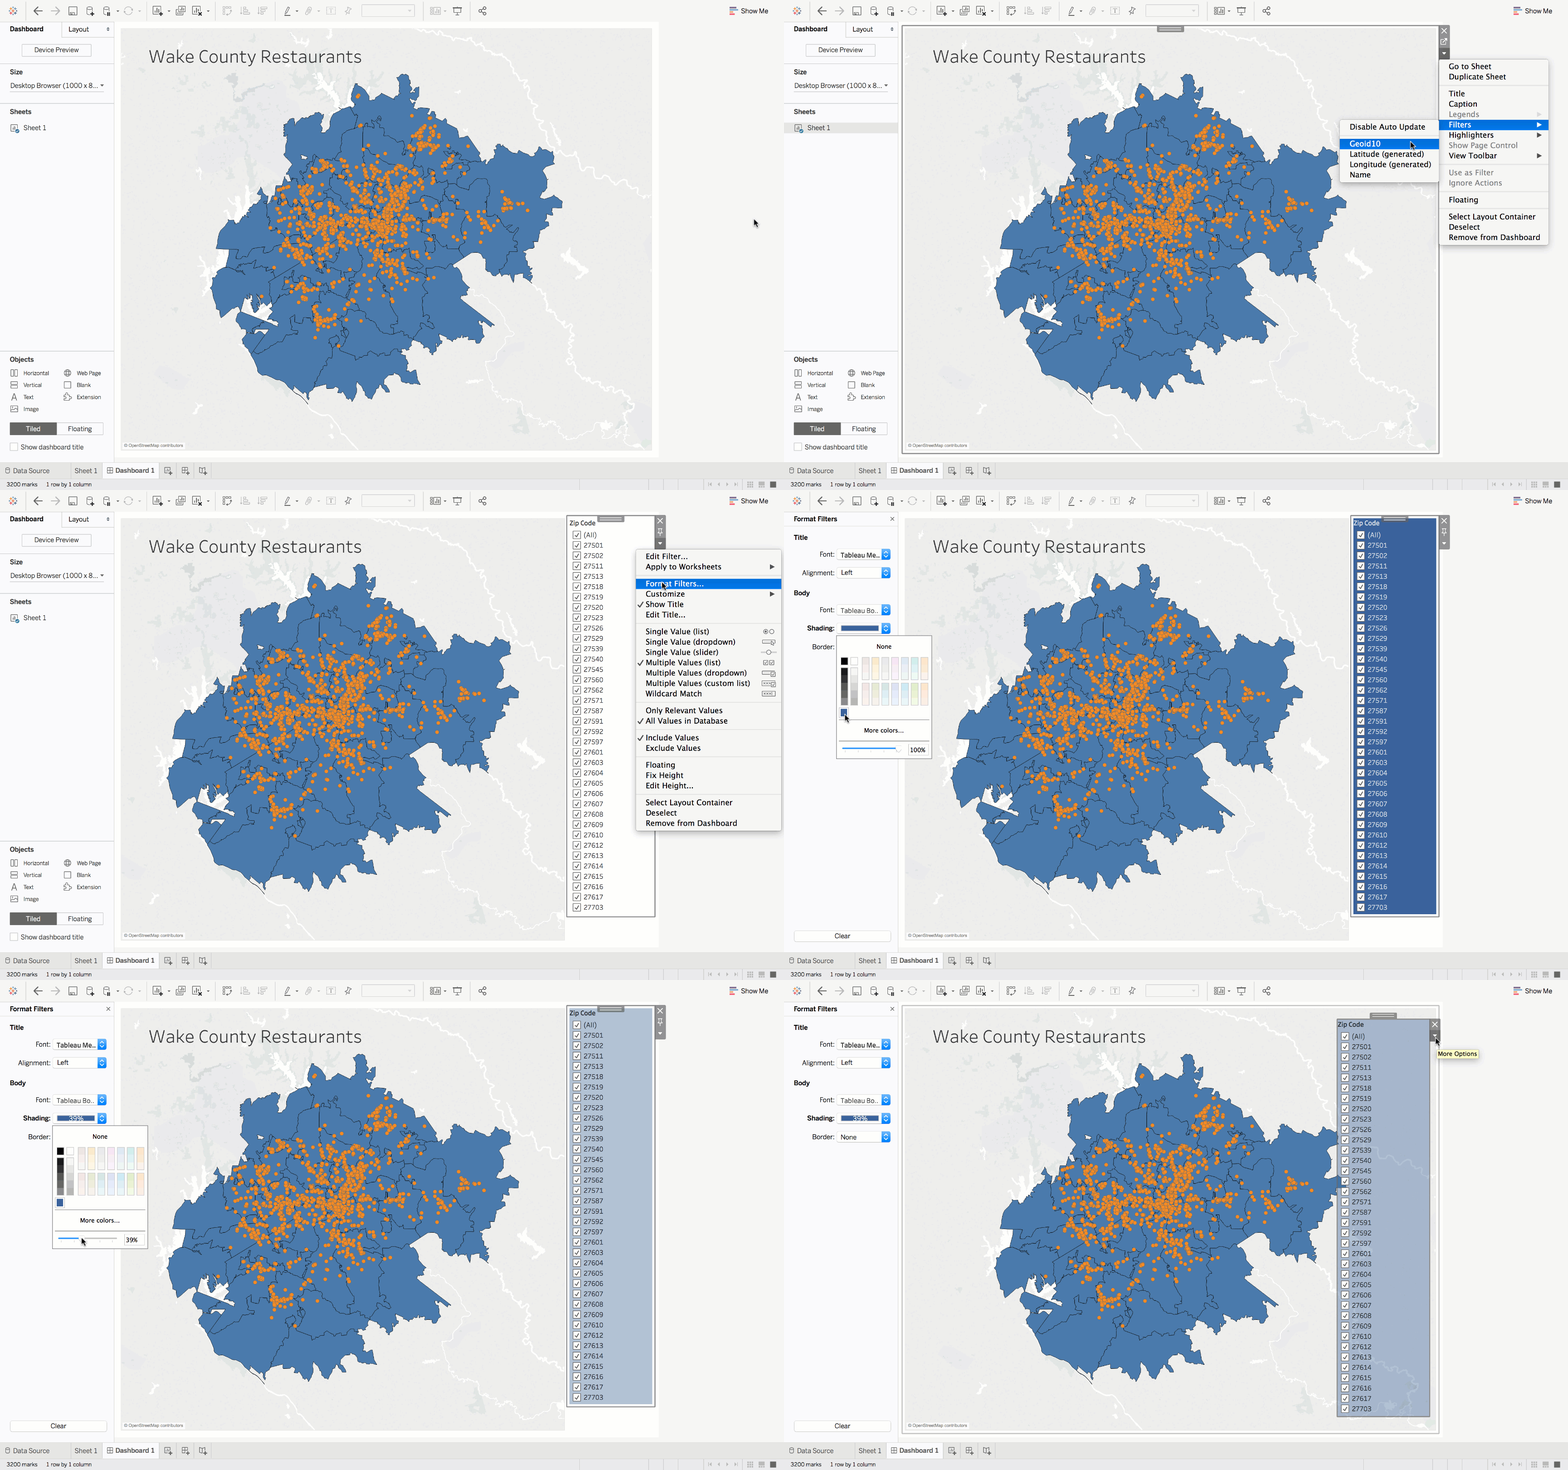
You can now make quick filters, highlighters, and parameters transparent, making it easy to have a consistent look across your entire dashboard. Here's how to make a transparent filter:
- Select a viz in a dashboard
- Add quick filters, parameters, or highlighters using the viz's dropdown menu
- Select a filter
- Using its dropdown menu, select Format
- In the Formatting pane, under Body, select Shading
- Select a color and use the slider control to adjust the level of transparency

Spatial Join
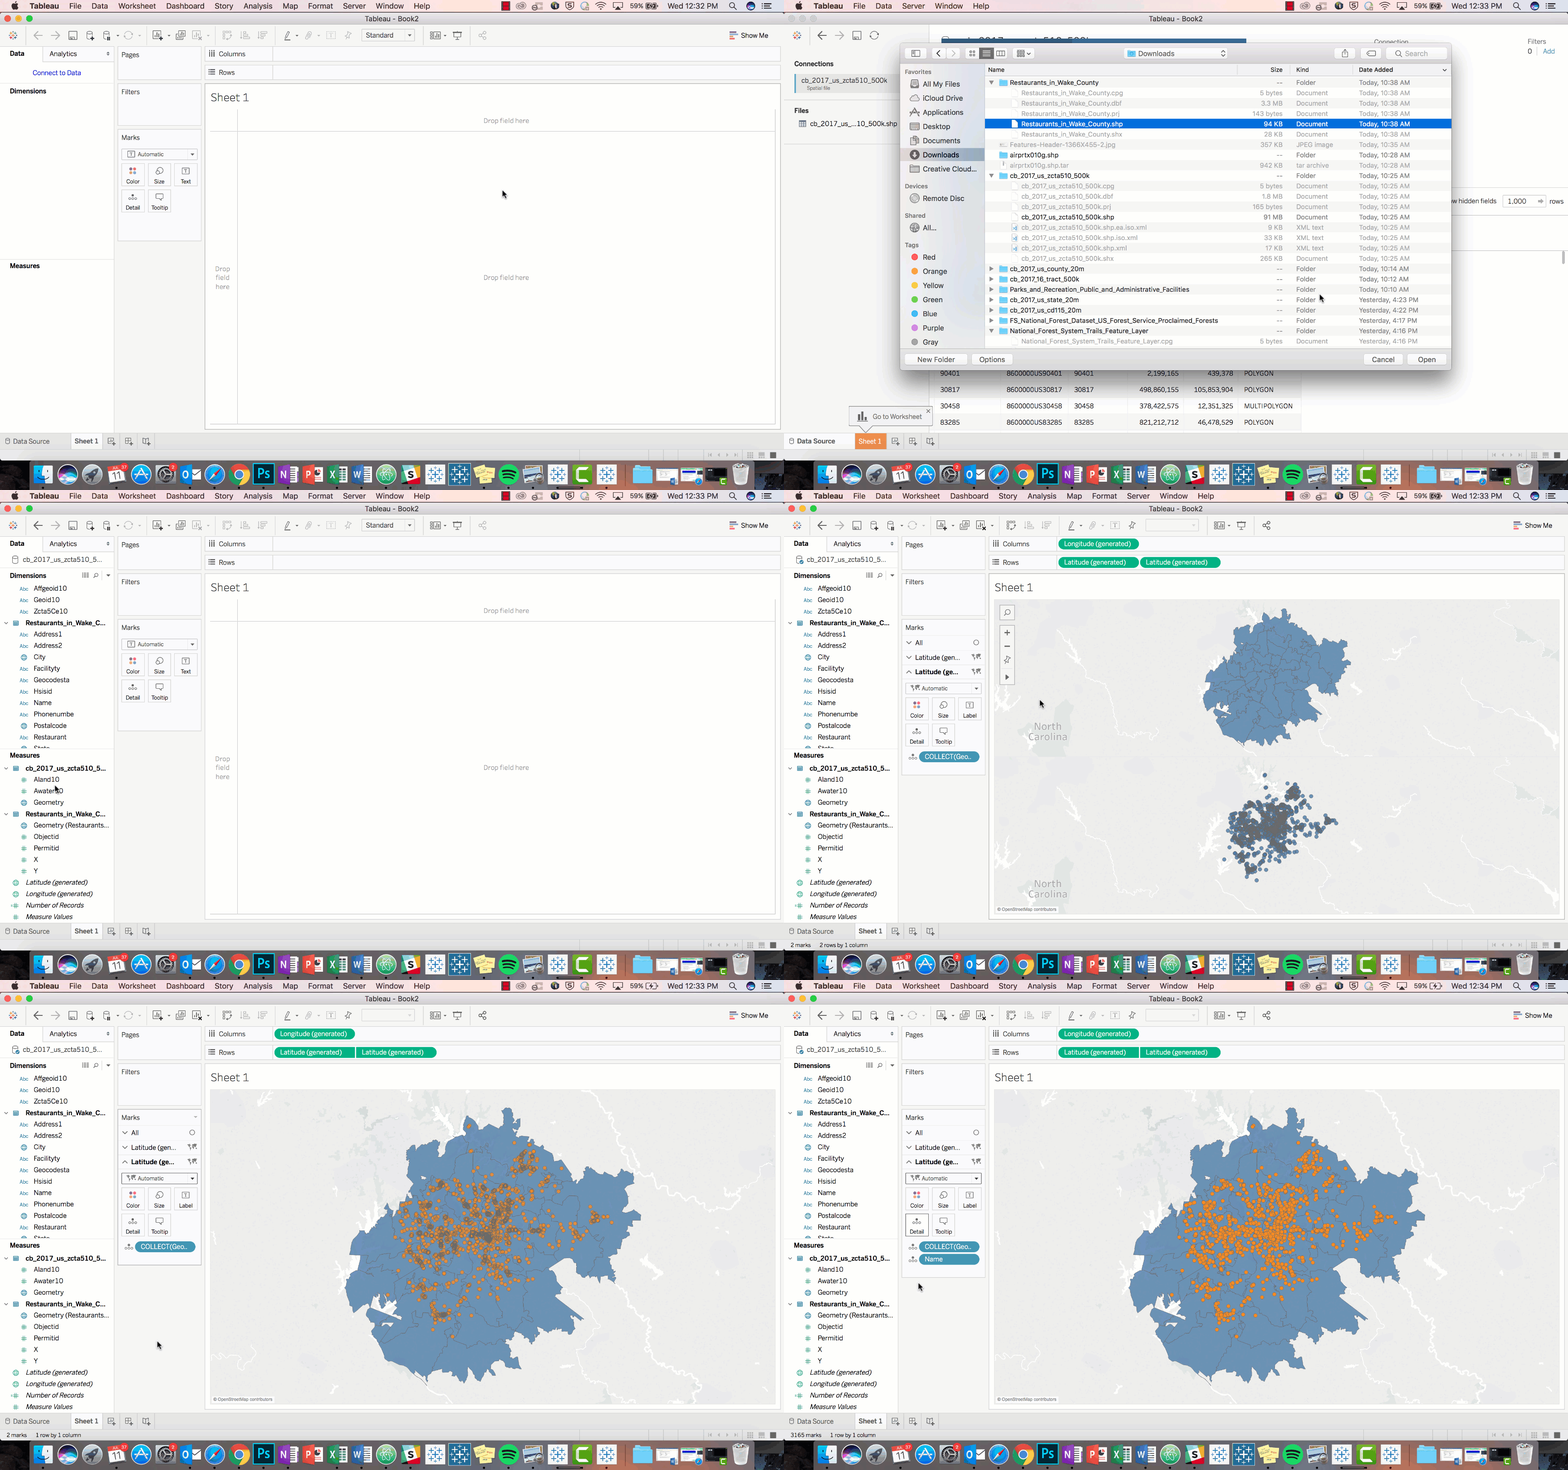
You can now join datasets where the only common element between the two is location. Easily analyze points within a geographic area for deeper understanding of your spatial data. Here's how it works:
- Create a new workbook and connect to a spatial data source containing polygonal data (US Zip Codes shape file)
- Add another spatial data source containing point data (Wake County Restaurants shape file)
- Set the join to Geometry Intersects Geometry
- Create a viz with the resulting joined data, for example plotting points from one shapefile with tooltips showing fields from both sources
- Use dual-axis plotting to view the joined shapefiles simultaneously.

Tableau Public 2018.2 also introduces a change in how lines and polygon edges are rendered, which makes it much easier to generate arc paths. Stay tuned for future blog posts diving deeper into additional mapping capabilities with 2018.2.
-The Tableau Public Team
Verwante verhalen
Subscribe to our blog
Ontvang de nieuwste updates van Tableau in je inbox.


