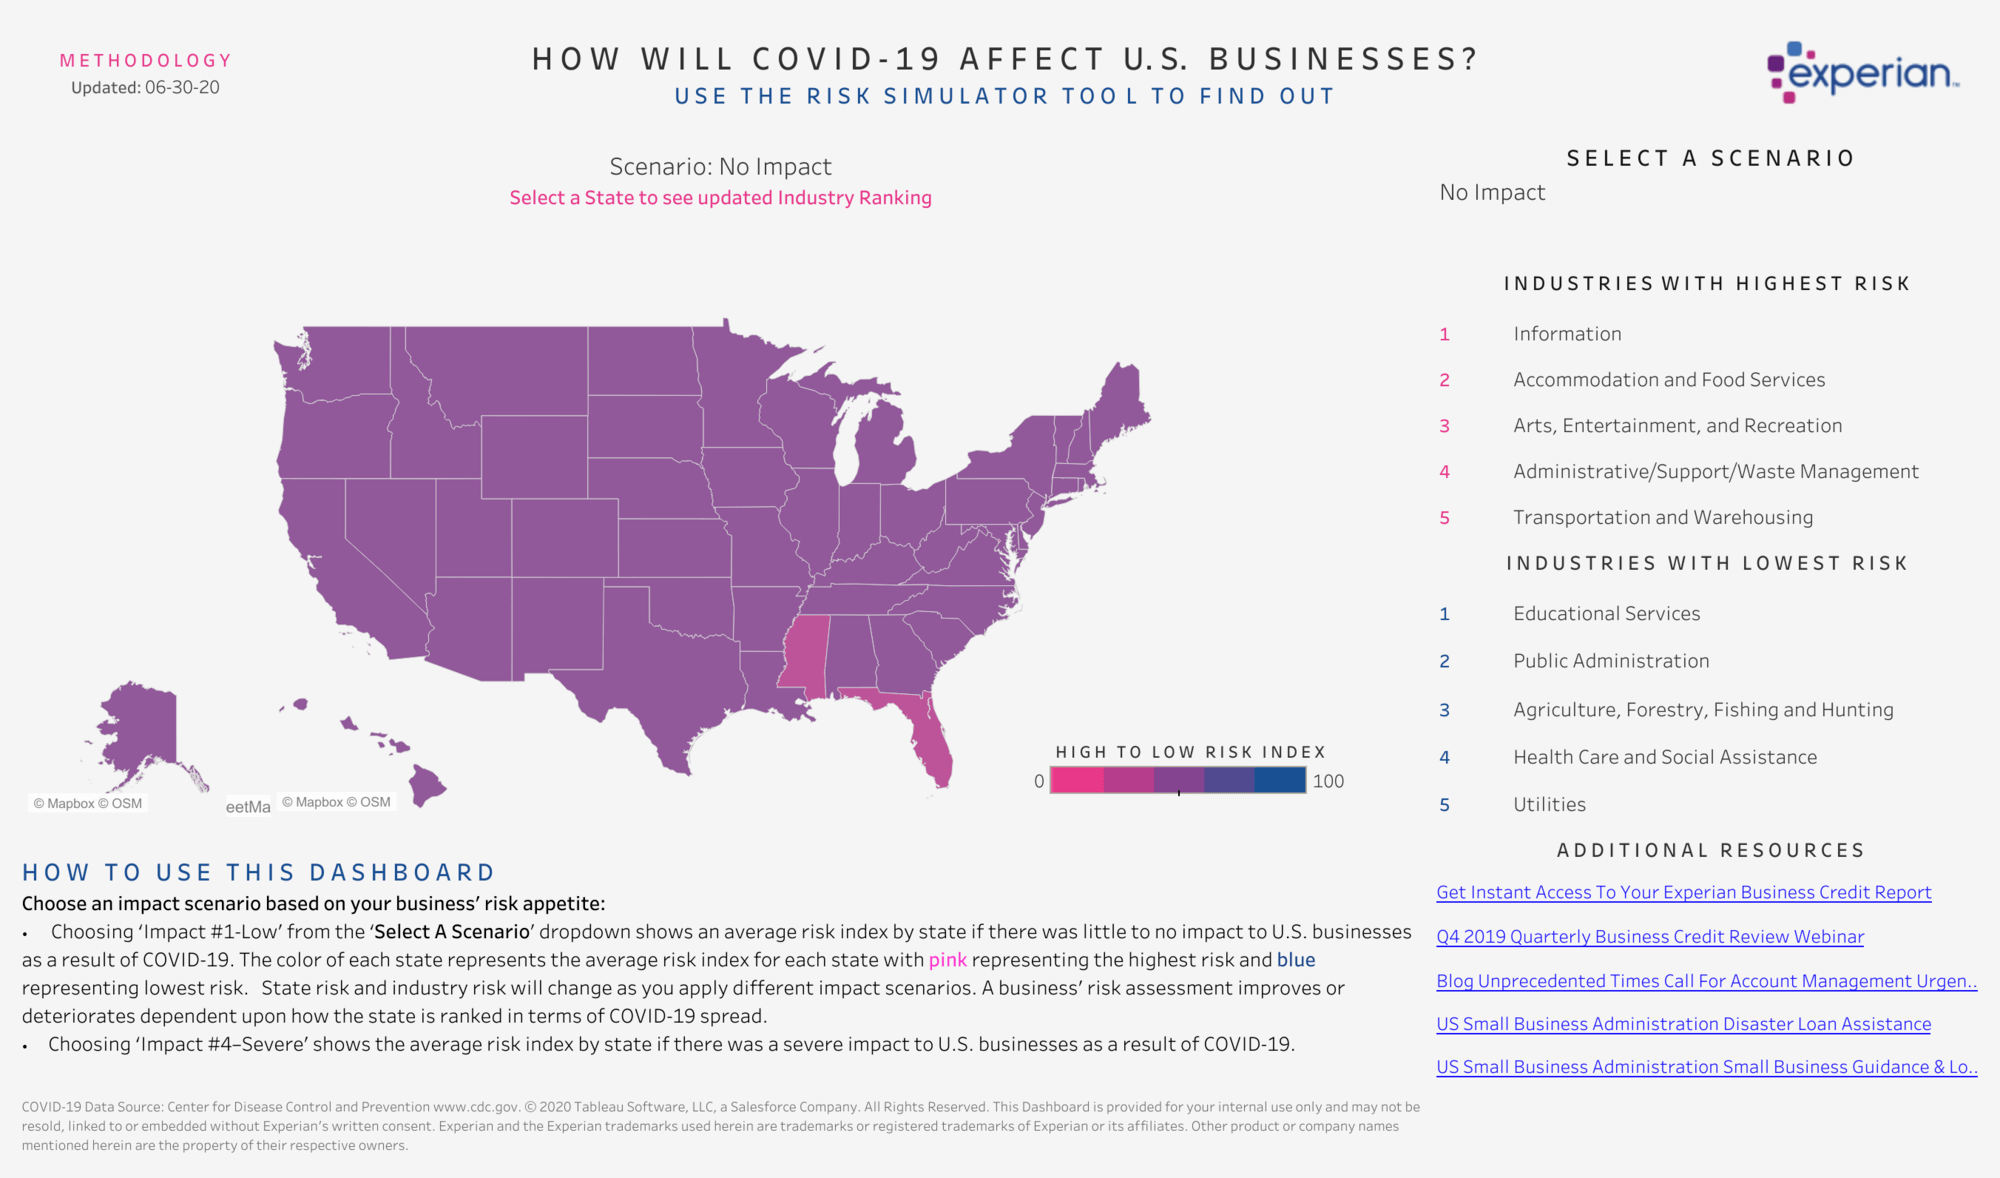
How will COVID-19 affect U.S. businesses in the long term? Experian's Risk Index dashboard reveals possible risk scenarios.
Experian Business Information Services (BIS), a division of Experian, provides data and predictive insights for a variety of companies, from small and midsize businesses to financial services and other market participants like insurance carriers, commodities and manufacturers. These service providers support small businesses in the United States by using Experian data to fully understand their credit situation and support their growth.
Experian understands that a business' potential is measured by more than just a credit score. Other factors include the business type, size, location, and industry, along with less tangible criteria. Side by side, two businesses can have the same credit score but experience vastly different impacts from environmental and economic conditions. And not surprisingly, accounting for these shades of difference has never been more important than during the COVID-19 pandemic.
"We're a business-to-business company, and some businesses are hurting more than others," said Nicolette Emory, Senior Product Manager - Business Intelligence from Experian’ Business Information Services. "We needed a way to help lenders gauge the pandemic's impact on very specific business scenarios, so they could make better decisions faster, to try and help small businesses stay on their feet."
Experian built its COVID-19 Risk Index dashboard in Tableau to better assess the pandemic's impact on small businesses by geographic area. The index combines public health data with Experian's wide range of proprietary macroeconomic data. Experian analysts built the dashboard's first iteration in one weekend to provide easily accessible, relevant insights in response to the rapidly advancing virus. While paying customers can also access fee-based premium features, the public version offers a powerful way for companies at large to gain insight into COVID-19's business impacts and trends.

Experian's Risk Index dashboard, publicly available on Tableau Public
"The current crisis makes it more important than ever to help businesses make more informed decisions using data and insights. So with this dashboard we’re giving access to advanced analytics which helps businesses make more informed decisions." —Nicolette Emory, Senior Product Manager of Business Intelligence
Service providers use risk data to modify business operations and strategies
The Risk Index lets users select a level-of-impact scenario and then visualize industry-specific data about risk tolerance on a state-by-state basis. Lenders use the index to not only understand and gauge areas of relative credit risk, but also to modify their operations and business strategies in response to the pandemic.
Service providers can answer questions like:
- What new considerations and adjustments should they apply to underwriting?
- What additional products can they add to their portfolio that target small businesses in certain regions?
- What processes can they automate without sacrificing quality or results?
- In what geographic areas should they anticipate and prioritize the need for forbearance and forgiveness, based on many characteristics that are likely to produce a specific impact?
"Our clients benefit greatly from having insight into trends that help them predict what's coming," said Matt Shubert, Director of Data Science and Modeling. "For example, the Risk Index identified the uptick in jobless claims in Louisiana and other parts of the South weeks before unemployment statistics in those areas were officially announced. Seeing this helped some lenders refocus their resources and plan accordingly."
The index also supports planning for geographic areas where lenders can apply fraud investigation resources, as well as predict where fraud will be less prevalent.
"Companies are using the index to inform their decisions about the full life cycle of each loan, from origination through collections. Customer service and retention is very important. Lenders want to continue working with these small businesses long after the COVID-19 crisis is over." —Brodie Oldham, Senior Director of Analytic Consultancy
Establishing best practices for rapid dashboard development
In building the Risk Index, Experian affirmed several best practices for successful rapid development. The project team determined they needed stakeholder signoff up front on the dashboard design, and to provide a clear breakdown on the level of effort needed for completion. Project leaders used an agile process and made sure all roles were in place to develop and support the dashboard. To optimize user experience when publishing on Tableau Public, they specified a minimum size rather than using the default, which improved readability across screen types, and removed extraneous metadata to maintain focus on the index capabilities.
Because of these efforts, the index has helped achieve internal acclaim for the data science and product teams who collaborated on it. Their ability to turn available data sources into an actionable tool for their clients is inspiring other teams around Experian to plan similar projects.
Planning for COVID-19 recovery efforts
Next up, Experian plans on developing additional indexes that analyze small business' resilience to the COVID-19 crisis and gauge their probability of post-pandemic recovery. Meanwhile, Experian continues to update the Risk Index data and feature sets based on internal and client feedback. These combinations of insights will continue to support win-win-win scenarios, where Experian can offer refined products to service providers, the providers can be more agile and strategic in their decisions, and the small businesses they serve have the services they need to be successful.
"Insights are what's needed in times like these," Nicolette concluded. "We encourage any business that feels they have insights to offer to publish on Tableau Public. Everyone can contribute right now—everyone. And Tableau makes it very easy to take that leap."
Verwante verhalen
Subscribe to our blog
Ontvang de nieuwste updates van Tableau in je inbox.


