Data & insights for tracking the world’s most watched election
Today, Tableau is announcing a new partnership with SurveyMonkey and Axios to bring exclusive public opinion research to life through rich visual analytics. Powered by SurveyMonkey’s vast polling infrastructure, Tableau’s world-class data visualization tools, and Axios’ incisive storytelling, this resource will enable anyone to delve into of-the-moment data and make discoveries.

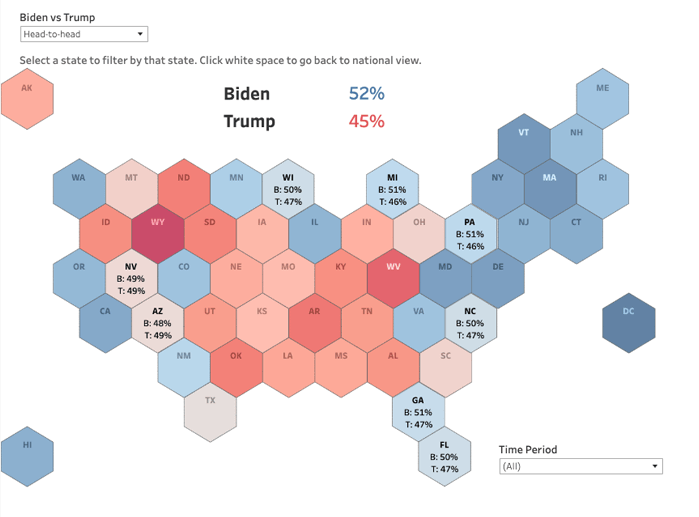
Data is how we understand elections. In the leadup to major political events, we all become data people: we track the latest candidate polling numbers, evaluate policy proposals, and look for statistics that could explain how the electorate might swing this year. This has never been more true than during this year’s U.S Presidential election. Quality data and clear, compelling visualizations are critical to understanding the polls, and how the sentiment among voters could influence the outcome of the race. Today, Tableau is announcing a new partnership with SurveyMonkey and Axios to bring exclusive public opinion research to life through rich visual analytics. Powered by SurveyMonkey’s vast polling infrastructure, Tableau’s world-class data visualization tools, and Axios’ incisive storytelling, this resource will enable anyone to delve into of-the-moment data and make discoveries. In the leadup to the election, SurveyMonkey will poll a randomly selected subset of the more than 2 million people who take a survey on their platform every day, asking a wide range of questions, from election integrity to COVID-19 concerns to how people will vote. “It’s never been clearer that what people think matters,” says Jon Cohen, chief research officer at SurveyMonkey. “With people around the world tuned into the U.S. presidential election, we’re showcasing how American voters are processing their choices, dealing with ongoing devastation from the pandemic, managing environmental crises, and confronting fresh challenges in their daily lives.” The results from SurveyMonkey’s ongoing polls will be published in interactive Tableau dashboards, where anyone will be able to filter and drill down into the data to explore how everything from demographics to geography to political affiliation play into people’s opinions. “To understand public views, we need to go beyond the topline numbers that dominate the conversation,” Cohen adds. “The critical debate over race and racial disparities and deeply partisan reaction to the country’s coronavirus response both point to the need to understand how different groups perceive what’s happening and what to do about it.” As a platform purpose-built for helping people to peel back layers of complex datasets and gain insights, Tableau provides visitors a compelling avenue into better understanding this year’s pre-election landscape. “People need reliable, well designed data visualizations that are easy to understand and can provide key insights,” says Andy Cotgreave, Tableau’s Director of Technical Evangelism. “As Americans make their decisions ahead of the election, they need charts that are optimized for communication. Tableau makes it possible to quickly and easily build the right chart for any data, and enable people to understand the data for themselves.” Alongside the dashboards, Tableau and SurveyMonkey experts will contribute pointers on visualization best practices for elections, and resources to enable anyone to better work with survey data. And Axios, as the exclusive media partner for this project, will incorporate the data and visualizations into their ongoing analysis of the political landscape around the election. At Tableau, we believe that data is a critical tool for understanding complex issues like political elections. We also believe that where data comes from—and how it's understood in context—is essential. Through our partnership with SurveyMonkey and Axios, we aim to provide visitors with an end-to-end experience of polling data, from understanding how SurveyMonkey’s polling infrastructure produces robust datasets, to seeing them visualized in Tableau, to watching them inform political commentary through Axios. Data doesn’t just answer questions—it prompts exploration and discussion. It helps us understand the complex issues shaping our jobs, families, and communities. Helping people see and understand survey data can bring clarity to important issues leading up to the election and lets people dig deeper to answer their own specific questions.
Verwante verhalen
Subscribe to our blog
Ontvang de nieuwste updates van Tableau in je inbox.


