Alle verhalen
 Iron Viz
Explore the 2023 Iron Viz Entries
 15 november, 2022
Explore the 209 impressive visualizations submitted during the 2023 Iron Viz global qualifier contest. This year’s theme was games.
15 november, 2022
Explore the 209 impressive visualizations submitted during the 2023 Iron Viz global qualifier contest. This year’s theme was games. Tableau User Groups
What is the Veterans Advocacy Tableau User Group?
 11 november, 2022
Learn about how a Tableau User Group is enabling anyone to advocate for veterans
11 november, 2022
Learn about how a Tableau User Group is enabling anyone to advocate for veterans Community Projects
What is the Tableau Community Project—Games Night Viz?
 10 november, 2022
Learn about the monthly data visualization challenge that uses data from your favorite games to improve your data visualization, data preparation and design skills.
10 november, 2022
Learn about the monthly data visualization challenge that uses data from your favorite games to improve your data visualization, data preparation and design skills. Tableau Public
How Tableau Public Transformed Elisa Davis' Data Viz Career
 3 november, 2022
Tableau Public Ambassador Elisa Davis shares her data viz journey and how she landed a newish job where she "gets paid to viz all day."
3 november, 2022
Tableau Public Ambassador Elisa Davis shares her data viz journey and how she landed a newish job where she "gets paid to viz all day." Tableau Research
Digging into Data Landscapes
 26 oktober, 2022
Exploring opportunities to facilitate data reconnaissance through automation and visualization.
26 oktober, 2022
Exploring opportunities to facilitate data reconnaissance through automation and visualization.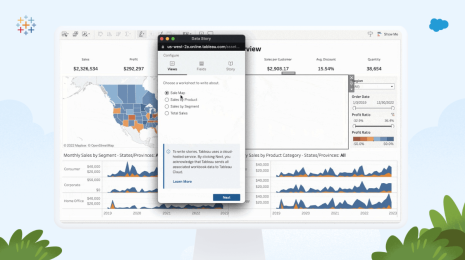 Releases
Inside the Release: Tableau 2022.3 for Analysts and Business Users
 25 oktober, 2022
Learn what’s in Tableau 2022.3 for analysts and business users, including Data Guide, Table Extensions, Dynamic Zone Visibility, and more.
25 oktober, 2022
Learn what’s in Tableau 2022.3 for analysts and business users, including Data Guide, Table Extensions, Dynamic Zone Visibility, and more. Releases
Nu beschikbaar in Tableau 2022.3: Datagids, Tabeluitbreidingen, dynamische zoneweergave en meer
 19 oktober, 2022
Met Tableau 2022.3 kun je eenvoudig nieuwe inzichten ontgrendelen over je data op schaal door nieuwe functies, zoals Datagids, Tabeluitbreidingen, dynamische zoneweergave en meer.
19 oktober, 2022
Met Tableau 2022.3 kun je eenvoudig nieuwe inzichten ontgrendelen over je data op schaal door nieuwe functies, zoals Datagids, Tabeluitbreidingen, dynamische zoneweergave en meer. Visualizations
Exploring Spatial Relationships in Tableau
 13 oktober, 2022
Maps are a great tool to visually analyze spatial patterns. In Tableau, it’s simple to add multiple layers of data on top of a custom base map to easily see patterns.
13 oktober, 2022
Maps are a great tool to visually analyze spatial patterns. In Tableau, it’s simple to add multiple layers of data on top of a custom base map to easily see patterns. Europe, Middle East, Africa
World Food Programme uses data to pivot to pandemic medical response
Pierre Guillaume Wielezynski describes how embedding Tableau dashboards into a new service marketplace enabled the World Food Programme to respond to Covid-19 Community Projects
What is the Tableau Community Project—Back to Viz Basics?
If you’re looking for a fun way to connect with data enthusiasts while also reinforcing foundational data visualization skills, Back to Viz Basics (B2VB)—a Tableau Community Project—is the perfect place to start.
Data Analytics: The Key to Unlocking the Retail Advantage
Data analytics provides retailers with a strong business advantage
 Tableau Community
What is a Data Viz Competition?
 13 september, 2022
Learn about the key elements that make up a Viz Game, or data visualization competition, in which contestants show off their design, analytics, and data storytelling skills.
13 september, 2022
Learn about the key elements that make up a Viz Game, or data visualization competition, in which contestants show off their design, analytics, and data storytelling skills.
Subscribe to our blog
Ontvang de nieuwste updates van Tableau in je inbox.