
Welcome to Tableau Pulse
You'll find all the resources you need to get started

Get AI-powered insights when and where you need them.
Tableau Pulse is a reimagined data experience that empowers every employee with intelligent, personalized, and contextual insights delivered in the flow of work. Without having to learn a new tool or build comprehensive visualizations, Tableau Pulse helps your organization integrate data into their daily jobs to make better, faster decisions.
See Tableau Cloud in actionAdditional Resources
Activate Pulse
Tableau Pulse may already be activated and can be accessed in the left-hand navigation bar of your Tableau Cloud home page. If not present, you’ll need to activate Pulse for your site as directed below.
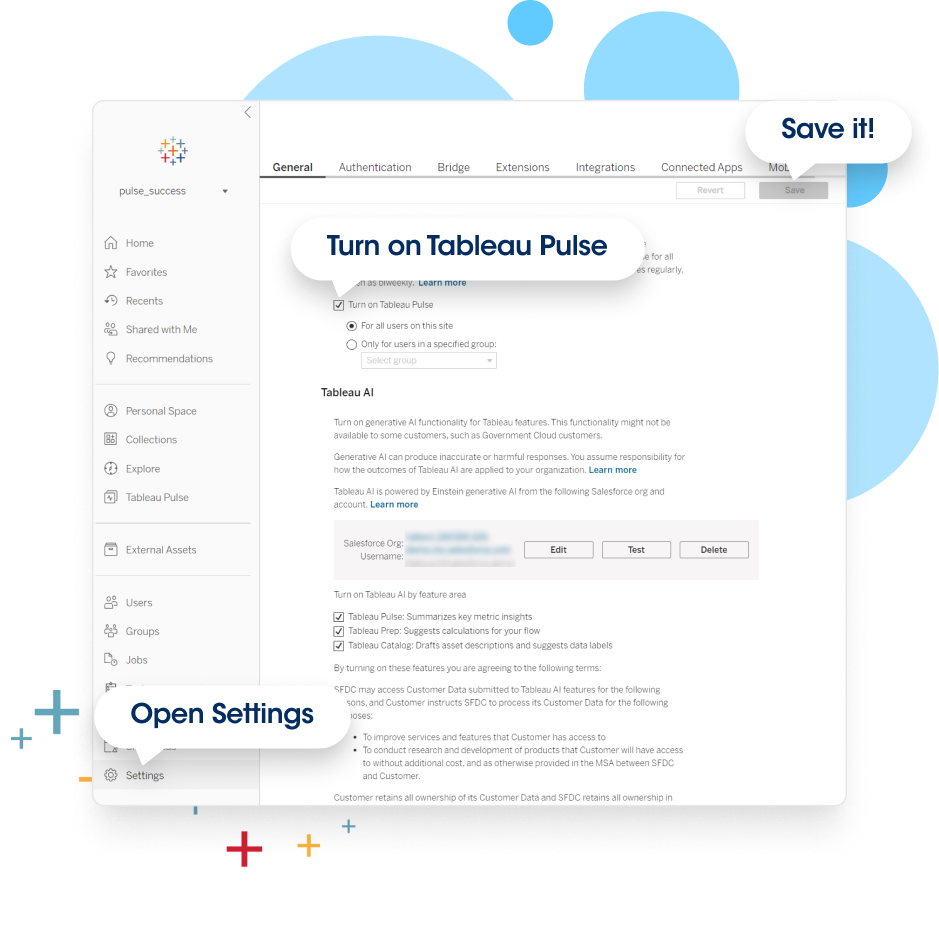
To deploy Tableau Pulse, visit the settings page for your site (Admin role required).
- From the main Tableau Cloud navigation menu, select Settings.
- Under Tableau Pulse Deployment, select Turn on Tableau Pulse.
- Choose whether to turn on Tableau Pulse for all users or for a specified group.
- If you choose to limit Tableau Pulse to a group, select the group. Note: Groups can be created & managed here.
- If you would like to activate Tableau AI features for Pulse, select the applicable Tableau AI features in the Tableau AI section.
Select Save.
Additional Resources
Create Your Metrics

Tableau Pulse provides insights about your data based on metrics that you define. These metrics function as the single source of truth for members of your organization to follow and receive regular email or slack digests.
- Access Tableau Pulse from the left hand navigation pane on your Tableau Cloud home page.
- From the Tableau Pulse home page, select New Metric Definition and Connect to your published data source.
- Provide a Name and Description (optional) to help others understand the metric they are selecting. The description appears on the definition page and in the info icon.
- Select the Values that define your metric.
- Measure: Select the underlying field to track from your connected data source
- Time: Select the date/time format from your data source
- Comparison Metric: Select how you want to see this metric over time (ex. Compare with Prior Year Performance)
- Select the Metric Filters you’d like users to be able to apply (ex. Region) and select any Number Formats as applicable.
- Save the Definition and you’re done!
Note: To create calculations in the Pulse Definition editor, use the Create Advanced Definition button.
Watch now
Create Metrics from existing Dashboards
Already have organizational reporting? No problem, you can create Pulse metrics directly from the Data Guide section of your existing published dashboards. Selecting these recommendations will pre-populate the metric within the Pulse definition editor.
Read MoreEnable AI Insights
Enable AI Insights with Pulse Metrics
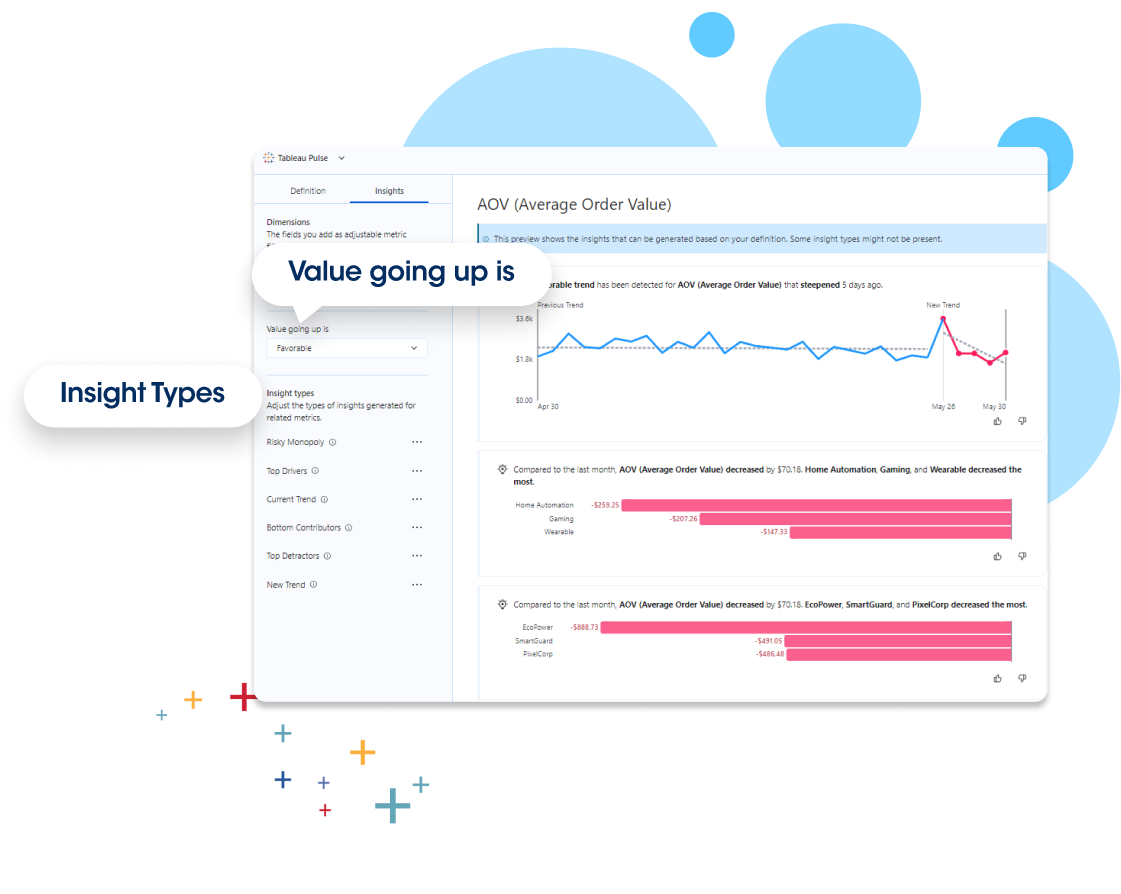
Insights can be used to inform your users of trends for your defined metrics. In the Insights section of the definitions editor, select from various Insight Types and set Value color coding to empower users with insights at a glance for the metrics they care about (Configure Insights).
Explore Metrics

Once metrics are defined, users can follow, interact and apply optional filters to scope the data for different audiences and purposes. When you follow a metric, insights about your data are delivered directly where you’re working–in email, Slack or viewable in Tableau Mobile.
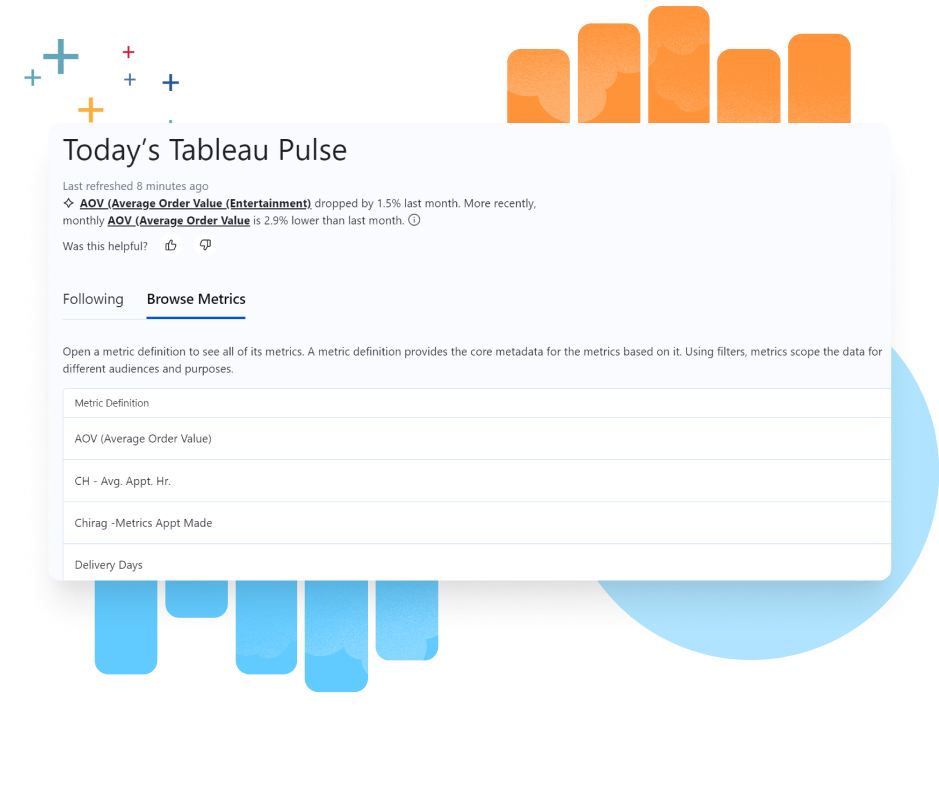
Watch nowBrowse and Follow Metrics: Browse and Follow Metrics that impact you the most by selecting the Browse Metrics section of your Tableau Pulse home page. Followed metrics will appear in the Following section and will collectively make up your daily digest.
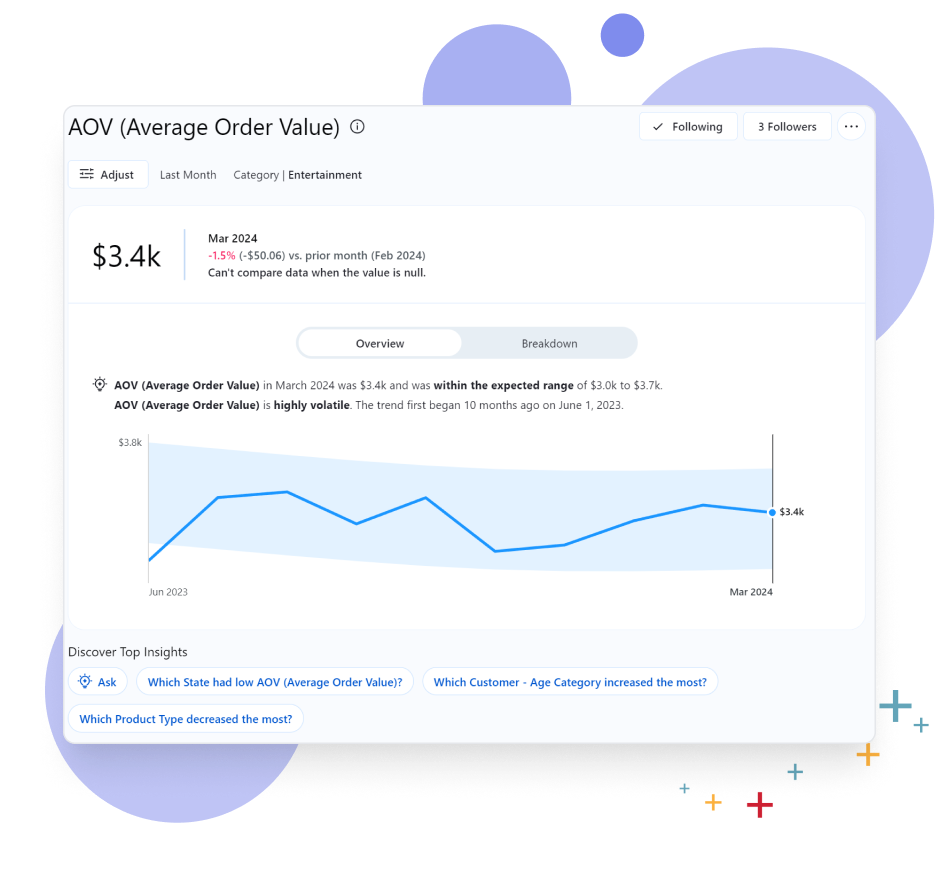
Access metric Overview and Breakdowns: By selecting any of your followed metrics, you will see the Overview tab that highlights metric performance, including the direction the metric is trending. Select the Breakdown tab to see how different values in your metric are contributing to the total value. You can select various dimensions by which you see your metric broken down.
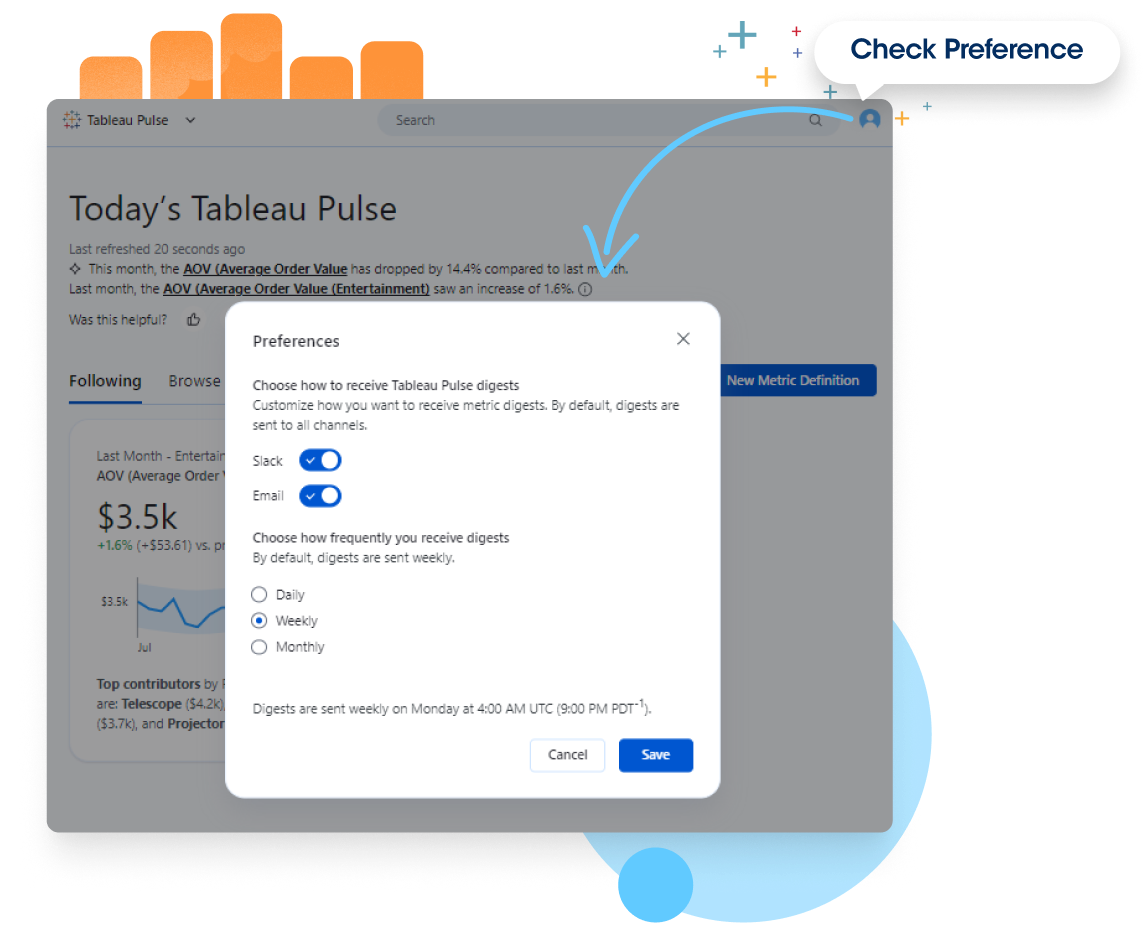
Set digest settings: From the Pulse home screen, select Preferences in the top right of the page. From here you can select if you would like to receive digests in Slack or Email as well as the digest cadence. Click save when finished.
Rollout
When you enable Pulse in your site, consider a rollout strategy that supports user adoption and drives metric clarity that empowered users within your organization.
- Controlled Rollout: Have your Admin enable Pulse access to user groups who can explore and evaluate Pulse metrics before access becomes more widely available.
- Enable Pulse on the Mobile App: Enable user access to Tableau Pulse metrics and insights whenever you need them through the Tableau mobile app.
- Integrate Tableau with Slack: Ensures users can obtain Pulse Digests directly in their Slack Workspace that enables data insight collaboration right where they work.
- Stay up to date: Tableau Pulse is adding new features and capabilities pushed directly to you automatically. Stay up to date with new Pulse feature releases and/or submit Feature Requests via Tableau Ideas community page.
- Track adoption of Pulse through Admin Insights data to understand things like how many metrics have been created, who is following specific metrics, which data sources are being used to create definitions, and more.
- Download the Tableau Cloud App for Microsoft Teams to access, share, and collaborate on your Tableau dashboards and Tableau Pulse Metrics within Microsoft Teams.