Whitepaper
Tableau Data Management
Trust, visibility, and governance for self-service analytics at scale
Tableau disrupted the business intelligence landscape with modern, self-service analytics. Bringing intuitive, visual analysis into the hands of those with domain expertise means people can begin to explore their own data questions and easily iterate on their analysis to discover new insights—without having to rely on IT. Now, as modern analytics deployments grow, IT is faced with challenges to curate, manage, and promote the right data, while business users struggle to find relevant, trusted data for their analysis.
On our mission to help people see and understand data, Tableau is investing in data management for our users in a unique way. With a highly visual solution that reaches users in the context of their analysis, we’re helping everyone in the organization know they have the right data and can trust it for decision-making. Increasing visibility, discoverability, and trust helps scale a governed data environment. This means IT can better manage the proliferation of data sources and analytical content, while end users are empowered to more quickly find the data they’re looking for and feel confident in their analysis.
Traditional data management processes no longer scale
For modern analytics to succeed, organizations must balance enablement and governance without compromising security. In order to scale, this means shifting the approach to data management to extend visibility and help end users find trusted data.
Organizations once captured and managed only relevant corporate data. Now, every department—from marketing and sales to finance—has diverse types of data and niche analytical needs to maximize its value. People are capturing data even before knowing what to do with it, and some departmental data and its applications may not even be on IT’s radar.
Contributing to this proliferation of data is also all the work done to get the data into the right shape and format for analysis. Often in traditional models, IT prepares data for a specific analytics use case, then continues to maintain the databases or files. While more data accumulates, IT seeks stability to support the data environment, but faces challenges in deprecating tables and data sources, unclear of the impact to users downstream and wary of breaking business-critical dashboards.
Modern analytics have helped shift IT’s role from building reports to maintaining and securing the systems that enable self-sufficiency for data-driven decisions across the organization. Business users are now bringing in diverse types of data that matter to them, but not yet in a scalable manner. Many processes are still manual and may involve moving data from governed to ungoverned systems for analysis. IT is embracing governance as guardrails to data and analytics exploration, rather than restricting access and causing a bottleneck. But IT still carries the responsibility of scaling self-service analytics to a broader audience, which demands operationalizing and automating processes, alongside a balance of control and agility.
As organizations increasingly rely on data-driven decision-making for organizational change, more people are asking to access and analyze data. While some business users are developing more sophisticated data skills, most don’t know what data they should be using or where to find it. From naming conventions to complex data structures, understanding databases, and which tables to join are challenging for everyday users. When data access was limited to fewer individuals in the company, it was easier to just ask a “go-to” data expert. Today, that doesn’t scale alongside growing use cases for data and the fast adoption of modern analytics.
Figuring out how data assets are being used across the organization has historically been either anecdotal—“who is using this and how?”—or a coding challenge, scraping content trying to find answers. Let’s say an ETL job fails, or there’s a table to be removed from a database. In a traditional, data management model, an administrator might update a wiki or send a mass email in hopes that the people to be impacted will get the message. Even if an organization has an enterprise data catalog with helpful data descriptions, documented lineage, and indicators of the data’s freshness, how often are end users logging in to this other system to see whether the data they are using is trusted and up to date before they begin their analysis?
Compliance requirements are also making it more challenging to ensure people are using the right data, which can hurt the perception of an organization to properly manage sensitive data. If IT wants end users to understand what data they should be using and whether there is a quality issue, people need information about its quality in the context of their analysis—not in a separate system or tool. Bringing this metadata directly to the users helps them know to trust their data.
Data consumers are demanding accelerated delivery of data, while data producers are facing increased pressure to access, review, qualify and deliver data quickly, according to Gartner survey data. Both are overwhelming traditional data management (and specifically integration) solutions.
How Tableau approaches data management differently
Through countless conversations with customers, we've seen clear problems with huge varieties of data, untapped investments in data warehouses and other management tools, and challenges in ensuring people are getting the right data to drive decision-making. Our approach to data management is unique from traditional solutions in that it surfaces metadata and integrates management processes into the Tableau analytics platform where people are already spending their time. This not only provides a visual experience that greatly benefits IT and everyday users, but can extend the power of existing data management investments.
Traditional data management solutions aren’t usually designed with multiple end users in mind. To scale a self-service environment where more people are accessing data, we recognize the importance of end users sharing some of the traditional data management responsibilities with administrators.
Where other data management solutions may help migrate data or integrate applications, Tableau remains heavily focused on analytics. We know it's valuable to give people the information they need when and where they need it—directly in the flow of their analysis.
We believe a visual interface is the best way to interact with your data. Whether you are searching for the right data, preparing your data for analysis, or exploring it for insights, visual interactions make the process faster and easier.
We understand the importance of leveraging your existing investments as your enterprise data environment evolves. We offer unparalleled choice—from your deployment options to our many native data connectors—and provide the same flexibility and extensibility to our data management solution.
Introducing the Tableau Data Management Add-on
With our approach to data management, we are empowering IT to develop and maintain a scalable, governed, and self-sufficient data environment in an ever-changing data landscape. The Tableau Data Management Add-on includes Tableau Prep Conductor and Tableau Catalog.
Visibility
Increase the visibility of your organization’s data assets to more efficiently manage your environment.
Governance & Trust
Build governance and trust in the data being used to make decisions across the organization.
Discoverability
Boost discoverability so users can quickly and confidently find the right data for their analysis.
Scalability
Effectively manage data at scale with repeatable processes to keep data and metadata up to date.

Tableau Prep Conductor
Schedule flows created with Tableau Prep Builder to run in a centralized, scalable, and reliable server environment so your organization’s data is always up to date. Give administrators visibility into self-service data preparation across the organization. With Tableau Prep Conductor, you can manage, monitor, and secure flows using your Tableau Server or Tableau Cloud environment. Learn more.

Tableau Catalog
Manage your analytics with a complete view of the data in your Tableau environment. Empower all users to find, understand, and make use of trusted data with powerful search, data dictionary, lineage, and impact analysis. Integrate with your existing metadata systems using the Metadata API, exchanging valuable metadata with Tableau to surface where people are performing analysis. Learn more.
Tight integration with the Tableau platform
Critical information is available to people where they need it—in the context of their analysis. Business users can easily find governed data in Tableau without searching through wikis or logging into an enterprise catalog to confirm that it’s trusted and up to date. Additionally, IT can leverage existing features and functions of the Tableau platform—from security, governance, and permissions, to monitoring and management. And there is no setup required—data assets in your Tableau Server environment are automatically cataloged.
The Tableau Data Management Add-on is licensed separately from your Tableau Server or Online deployment.
How Tableau Data Management benefits everyone in your organization
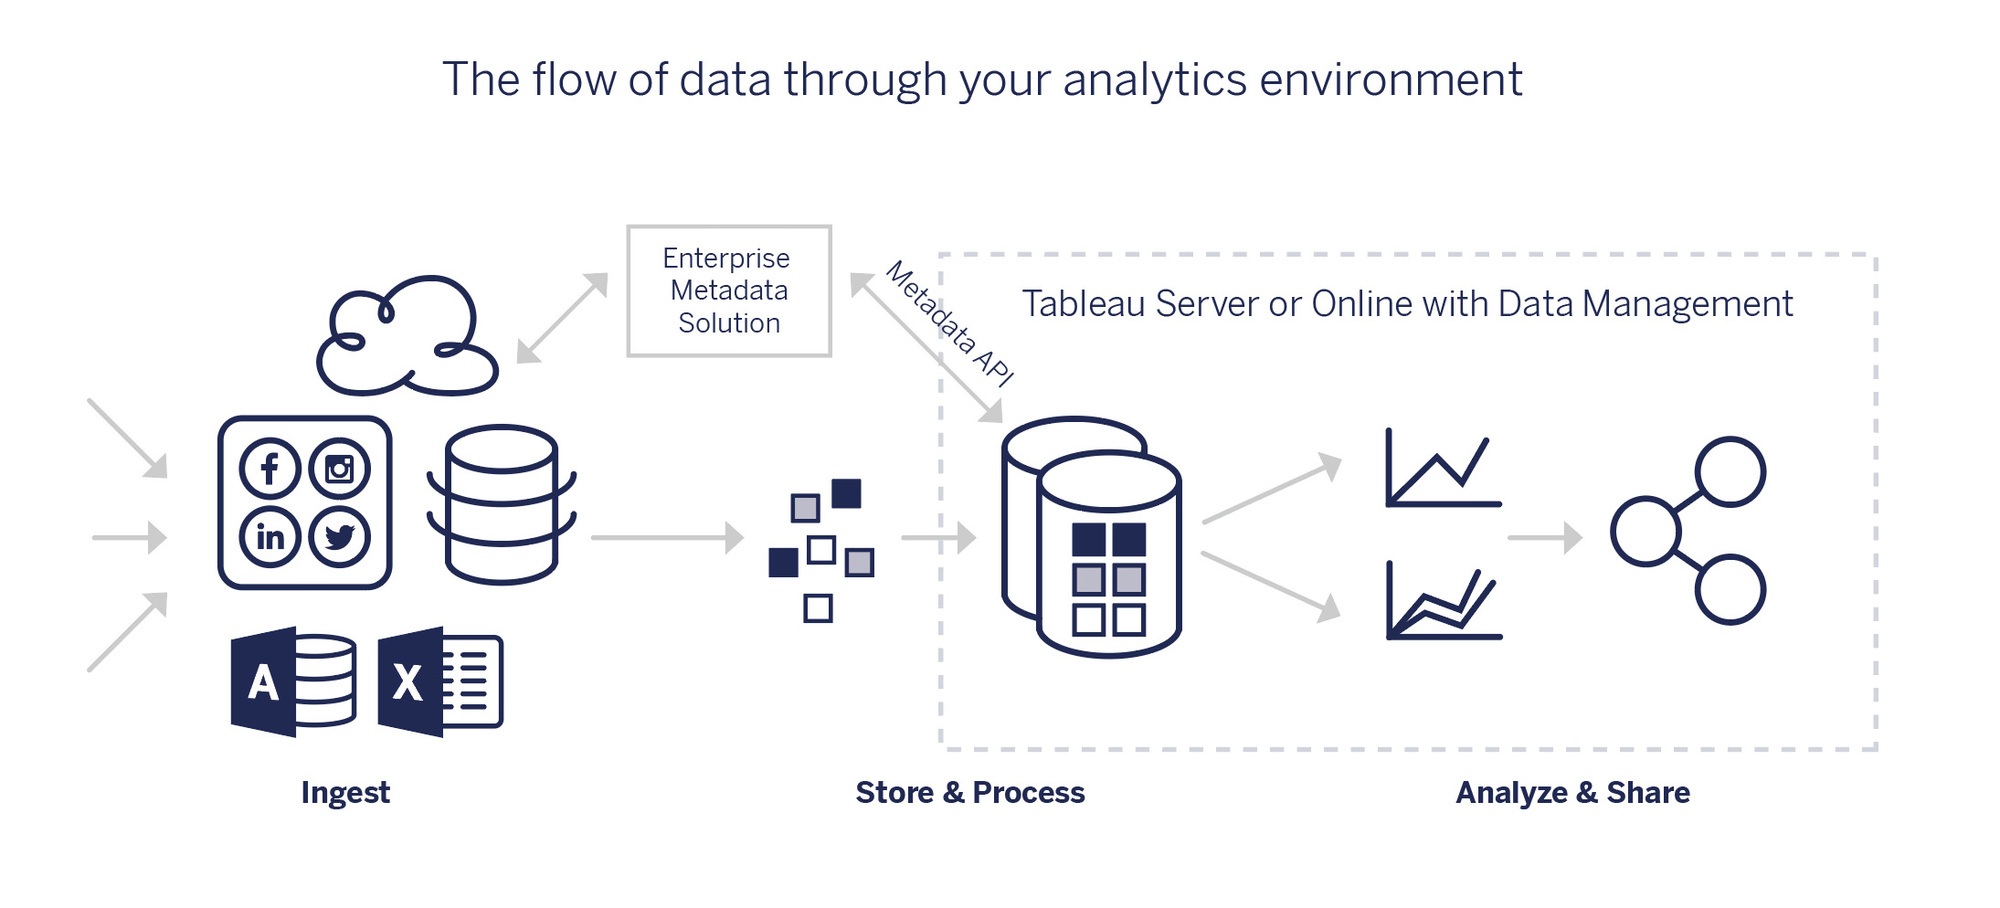
After your data is ingested and stored, it moves through preparation, analysis, and is then shared throughout the organization. We've tightly integrated data management processes—like refreshing prep flows, adding and accessing metadata, and understanding data lineage—into Tableau Server and Online where IT and business users are already in the analytics workflow.
Data curation & discovery
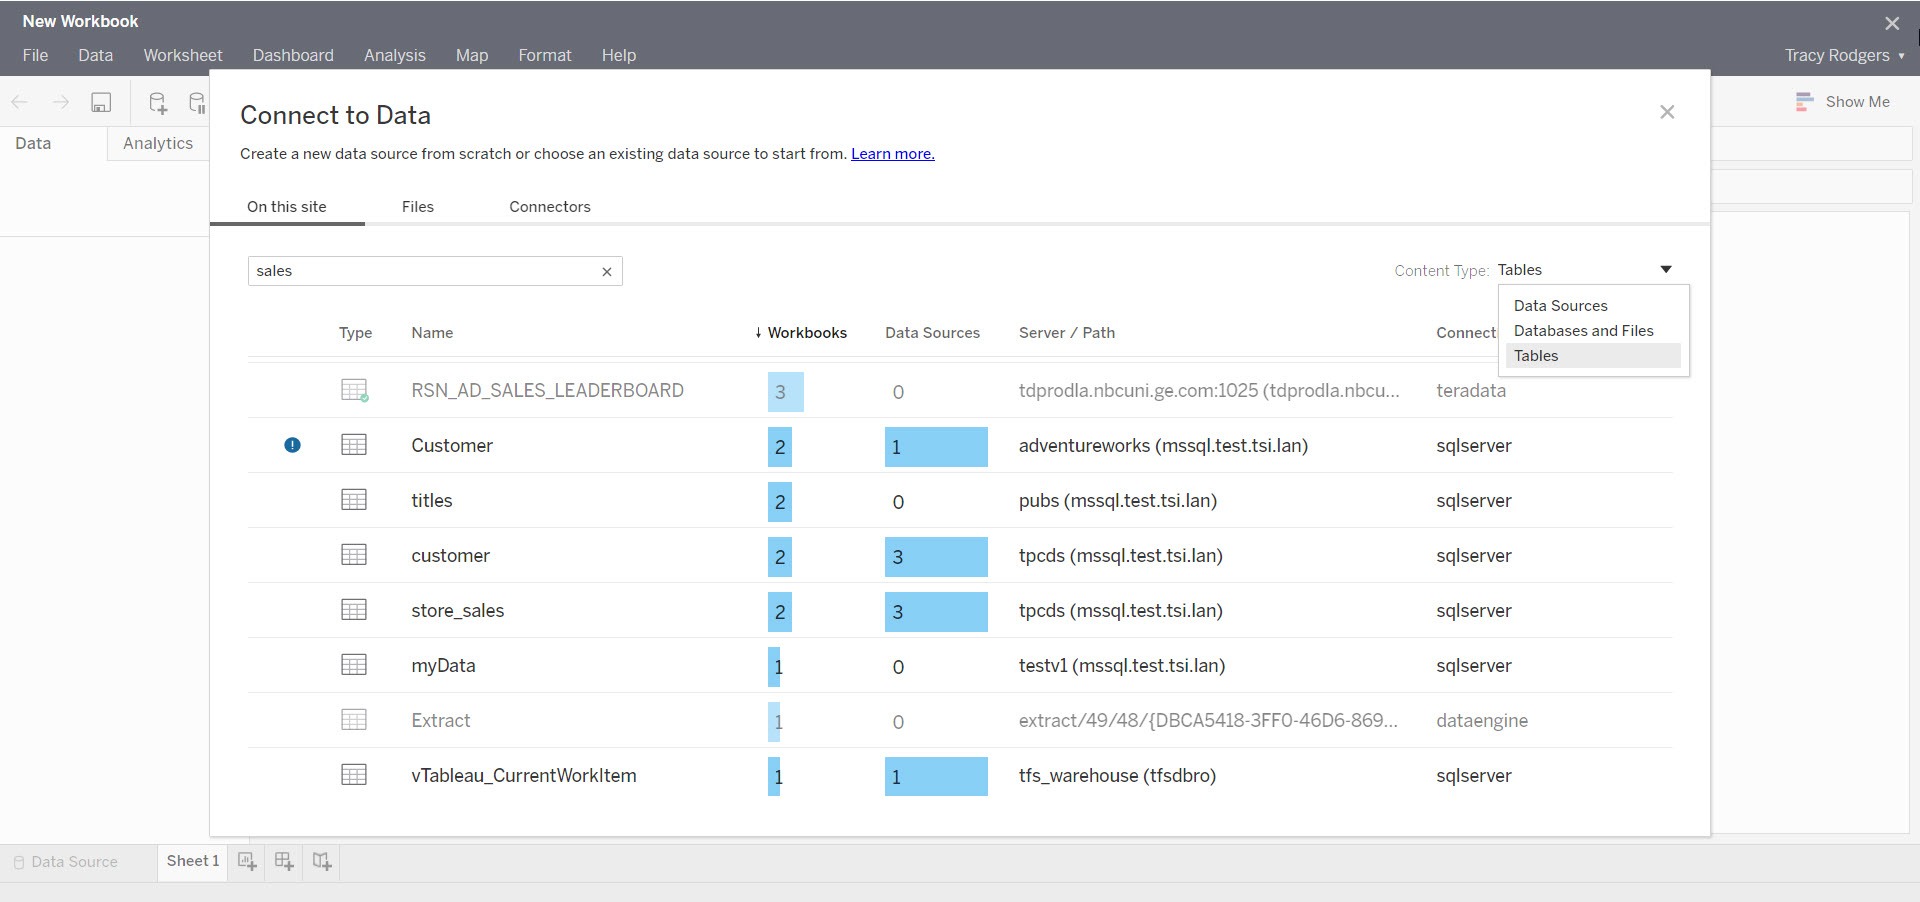
Data stewards and data engineers can add descriptions and metadata to databases, tables, and columns, as well as certify data assets to help users find trusted and recommended data. Developers can also use metadata methods in the Tableau Server REST API to programmatically update certain metadata. Data engineers and database administrators will benefit from usage metadata to inform changes in tables to optimize data sources.
Content authors can search existing data sources, databases and files, or tables in Tableau Server and Online to see if the data they need already exists, helping to minimize duplicate data sources. Content consumers can more easily find trusted data while browsing by seeing descriptions, usage, and certification for data assets. While looking at a viz, users can easily access field descriptions in the Data Details tab on the dashboard, giving them confidence that they are using the right data for analysis.
Lineage & impact analysis
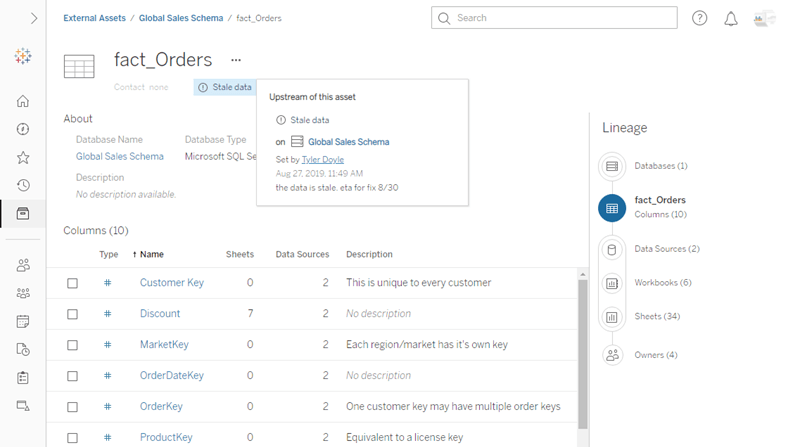
IT can perform impact analysis to understand which data assets and users will be affected by changes—like a database administrator or data engineer changing a column or table, or a data steward modifying a calculation. IT can email affected owners of data assets from within the Tableau platform.
Business users can quickly see the lineage of data they are using for analysis, including the origin and owner of the data, whether or not it’s certified, and prep flow run history—even before opening a viz. More advanced users may find analytical content published on the server and can dive in to explore calculations in workbooks.
Quality warnings & alerts
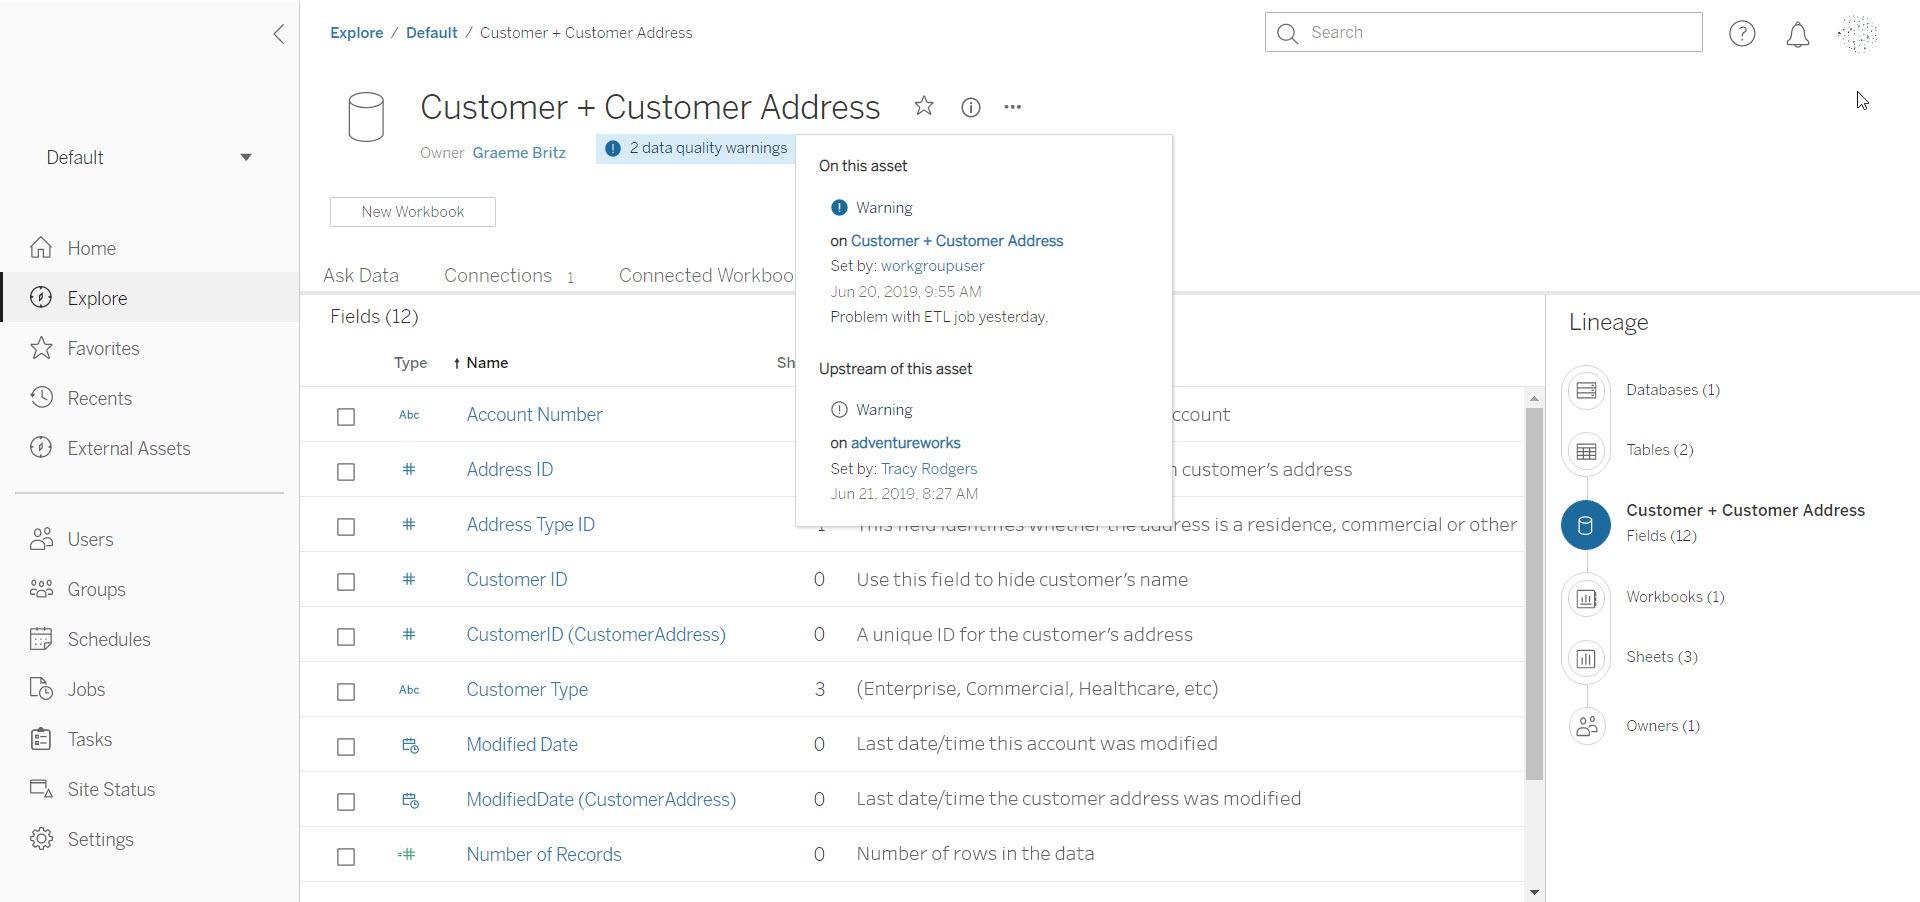
Data engineers and data stewards can set quality warnings directly in the server environment or through an API. These indicators—Warning, Deprecated, Stale Data, or Under Maintenance—help alert users to the status of data assets and provide additional information, like if a refresh is delayed or there is missing data that might compromise analysis. Prep flow owners, like data stewards or analysts, directly receive alerts for failed prep runs—like in the event of a database timeout or missing column—so they can quickly take action.
Business users will see quality indicators on data assets in the context of their analysis in Tableau. This can help people of all skill levels feel confident in making business decisions with the data, or in the event of a warning, they can read information from IT to decide whether or not to proceed with analysis.
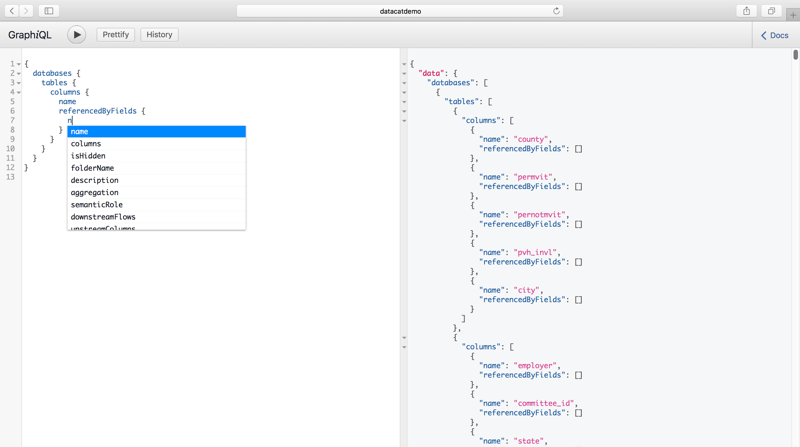
Metadata API integration
IT can utilize the Metadata API to extend the power of your existing metadata management solution. Pull metadata into Tableau that database administrators and engineers curated in metadata tables or an enterprise catalog, and extract metadata from Tableau to use in other data applications and business flows.
Business users can get visibility into the work IT has done with valuable metadata from the enterprise catalog where they’re most likely to see and use the information—in the context of their analysis in Tableau.
Try out the Tableau Data Management Add-on as part of your Tableau Server trial—get started today!
*Gartner does not endorse any vendor, product or service depicted in its research publications, and does not advise technology users to select only those vendors with the highest ratings or other designation. Gartner research publications consist of the opinions of Gartner’s research organization and should not be construed as statements of fact. Gartner disclaims all warranties, express or implied, with respect to this research, including any warranties of merchantability or fitness for a particular purpose.


