World Mental Health Day: Elevating Awareness Through Data Visualization


Every year on October 10, the world observes World Mental Health Day. This day aims to raise awareness about mental health issues, reduce stigma, and promote resources to help those in need. As people navigate a complex landscape of mental health challenges exacerbated by recent global events, compassion and understanding are critical. One powerful way to communicate these challenges is through data visualization, particularly using platforms like Tableau Public.

Why Data Visualization Matters
Data visualization turns complex data into understandable visual formats, making information accessible and engaging. When it comes to mental health, data can reveal alarming trends, highlight disparities, and show the effectiveness of interventions. However, raw numbers can often feel abstract or overwhelming. That's where data visualization shines—transforming statistics into stories.
By leveraging visuals, we can create empathy and drive action. For instance, a well-crafted viz can show the increase in anxiety and depression rates among different demographics over the years. This helps citizens of the world to not only see the data but also understand its implications.
Tableau Public: A Tool for Change
Tableau Public is an easy-to-use platform for anyone interested in data visualization. It allows users to create interactive and shareable visuals with drag-and-drop ease that can bring critical issues, like mental health, into sharper focus. With its user-friendly interface, even those without a background in data science can create impactful visualizations.
Imagine a dashboard that illustrates mental health resource availability across different regions, alongside statistics on mental health outcomes. By interacting with this data, users can explore correlations, such as how access to resources affects recovery rates. This not only informs but empowers individuals and organizations to advocate for better mental health resources in underserved communities.
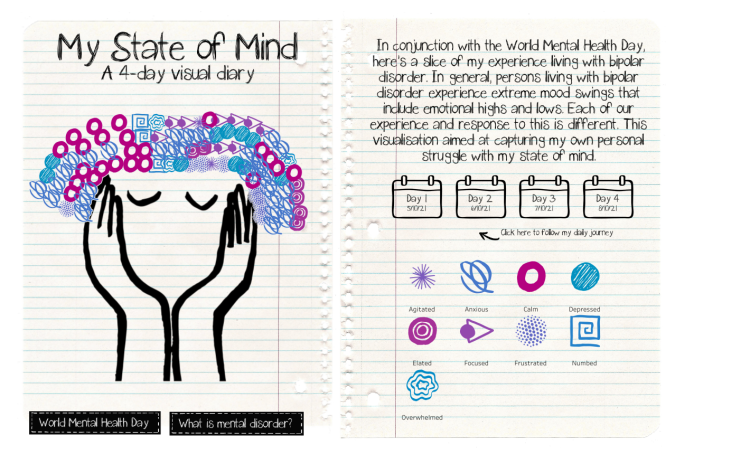
My state of mind : a 4-day visual journey

Mental Health Disorders in Tech OSMI

The Vicious Cycle of OCD (Trigger Warning)

Entrepreneurs and Mental Health

Age when first had anxiety or depression
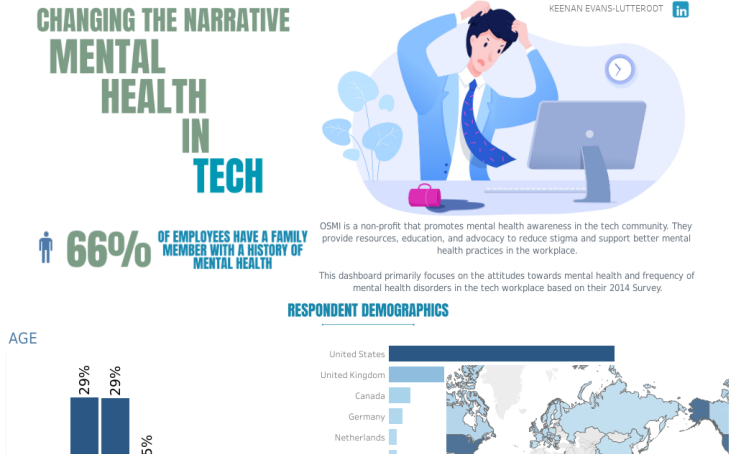
Changing The Narrative: Mental Health In Tech

Depression - Trigger Warning

Mindfulness

Coronavirus and Mental Health

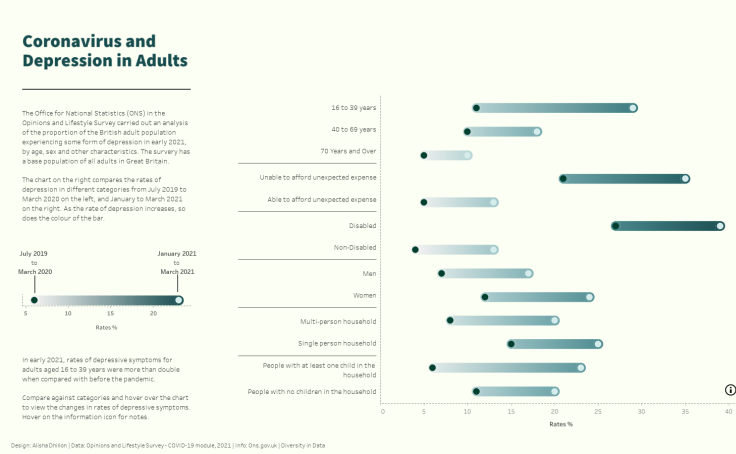
Diversity in Data - COVID and Depression in Adults

Mindfulness as Medicine
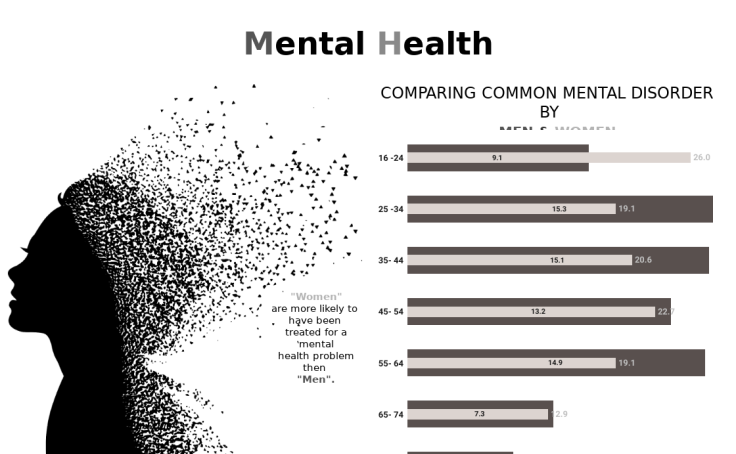
Mental Health

Mental Health vs Physical Health
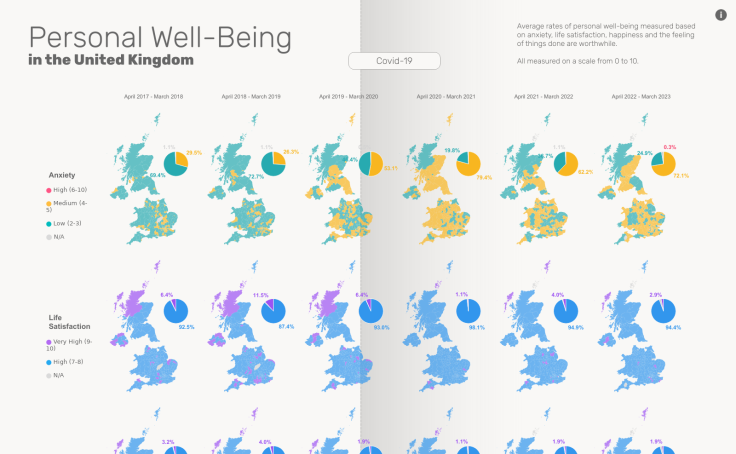
UK Personal Well-being 2017-2023
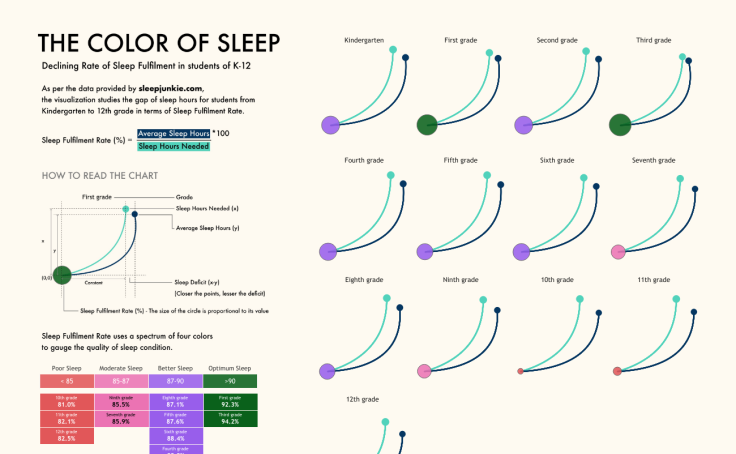
The Color of Sleep

The Importance of Sleep
Your Role in the Conversation
As we recognize World Mental Health Day, I encourage everyone to think about how data visualization can enhance society’s understanding of mental health. Whether you're a mental health professional, a data enthusiast, or simply someone who cares about the well-being of others, your voice matters.
By utilizing platforms like Tableau Public, we can all contribute to a more informed and compassionate society. Data-informed stories have the potential to make a real difference, bringing awareness and promoting change. Let's leverage the power of visualization to advocate for better mental health resources and support systems for everyone.
Storie correlate

Iron Viz 2025: Where Data Took Flight
 6 Maggio, 2025

DataFam Roundup: April 28-May 2, 2025

DataFam Roundup: April 21-25, 2025
Subscribe to our blog
Ricevi via e-mail gli aggiornamenti di Tableau.