Take your data skills to the next level—explore a viz in the browser
Editors note: This blog post was written by Tableau Zen Master Ravi Mistry.
Whether you’re an experienced Tableau user, or just getting started, one of the quickest ways to improve your data skills is by exploring the work of others. Many generous Tableau Public authors help to enable the community by leaving their vizzes downloadable so you can do just that. By reverse engineering or deconstructing someone else’s data visualization, you’re able to see exactly how it was built. It’s a great way to learn new techniques, fine-tune your design skills, and master creating calculated fields.
While you can download and pick apart your favorite Tableau Public visualizations, sometimes you just want to take a quick peek under the hood without the extra time it takes to download a viz. You might come across a visualization and find yourself wondering, “How did they get that action filter working?” or “What calculated fields are being used?” That’s where “Explore” comes in. Read on to learn about Tableau Public’s newest feature!
Explore with ease
You no longer need to download a workbook to your desktop to see how it was created. Now, you can simply hit the Explore button in the top-right corner and immediately begin exploring the viz directly in your browser. Once you’ve finished your edits, hit Save and the new version will be published to your profile, automatically crediting the original viz author. The automatic attribution component is included in the code and irremovable, ensuring that you always give credit where credit is due (without even thinking about it)!
See it in action
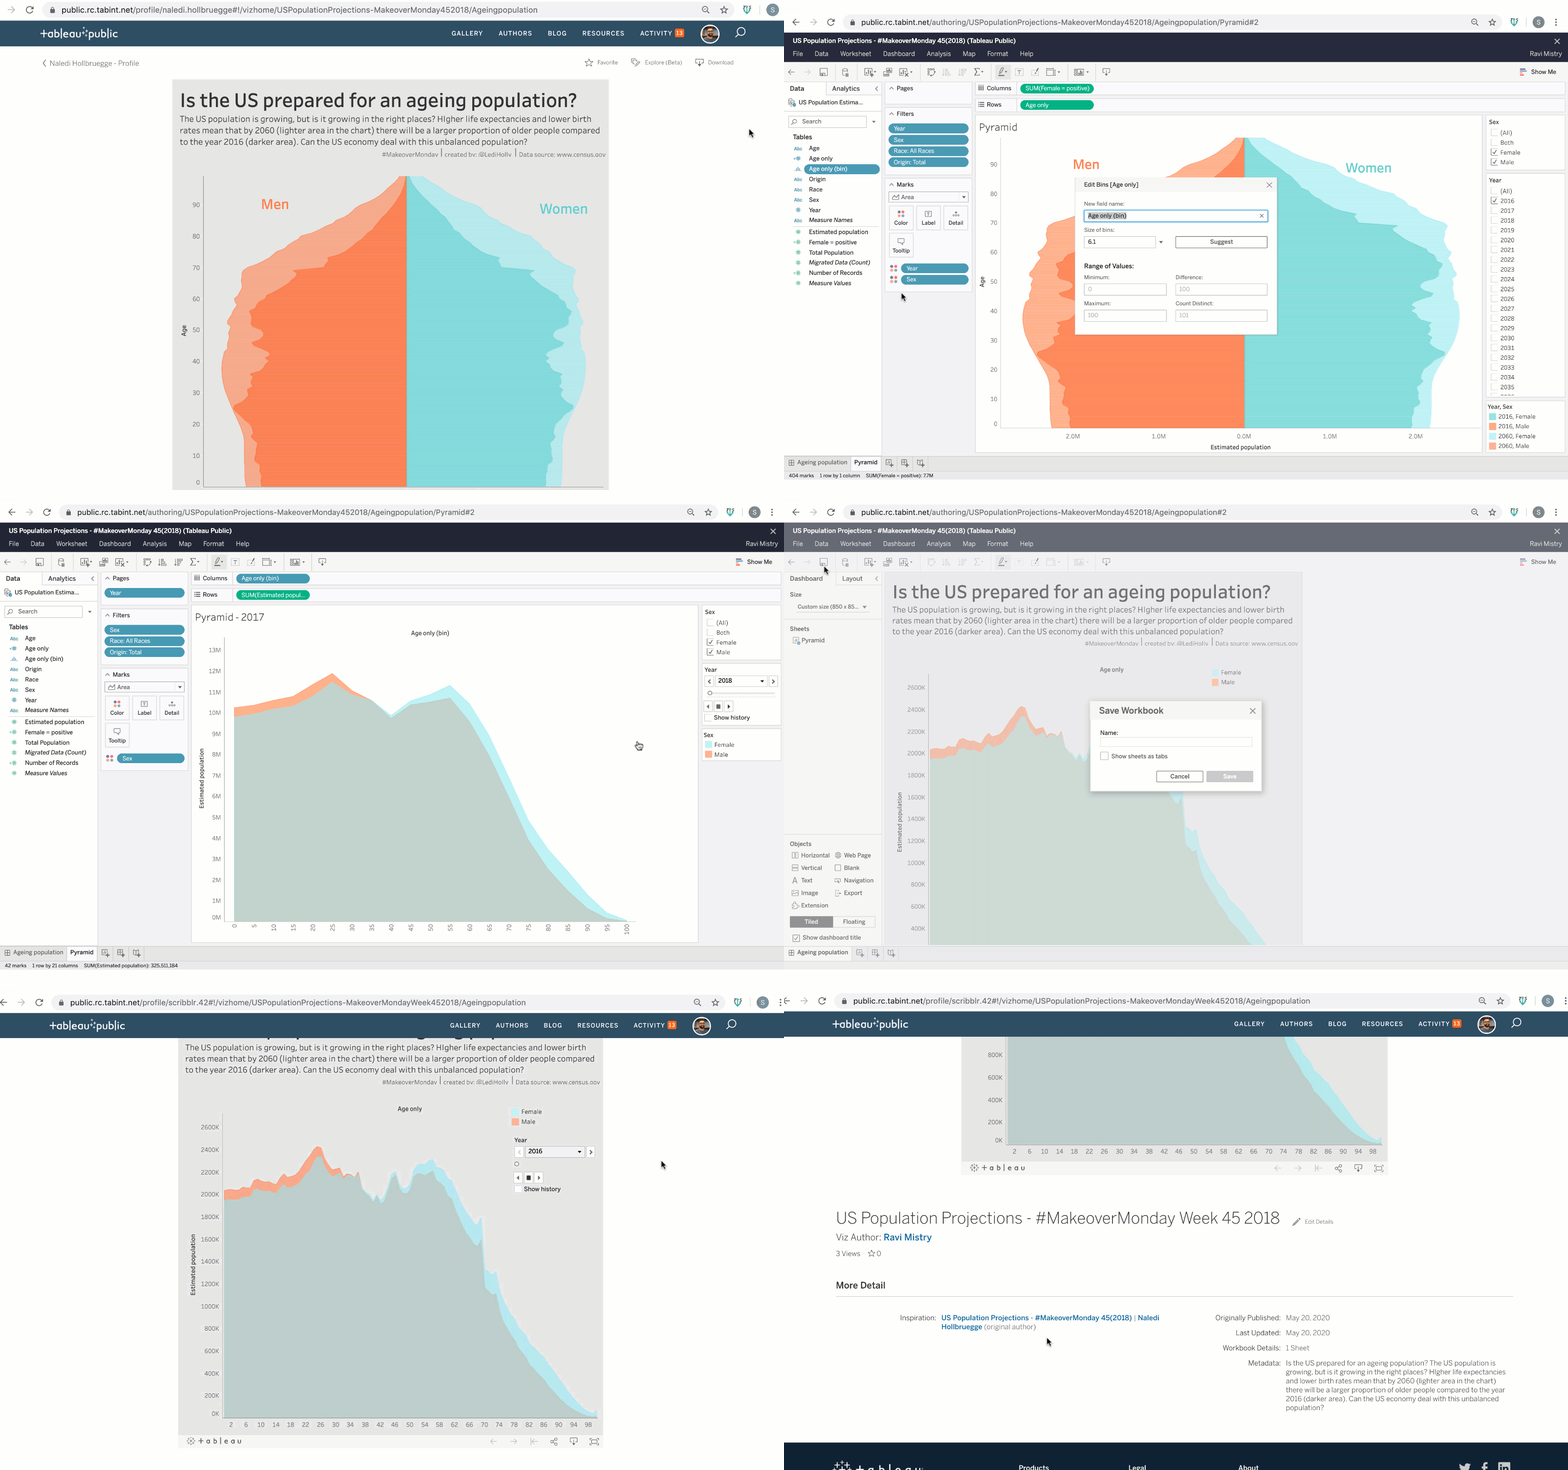
Let’s take this new feature out for a spin. I’ll be using this visualization created by Tableau Public featured author Naledi Hollbruegge for Week 45 of #MakeoverMonday. I was curious to know how Naledi built this viz, but I also wanted to see how it would look if I made a few tweaks. Specifically, I wanted to see how it might look when visualizing population projections for men and women on the same axis for easy comparison, so I decided to try out the new Explore feature. Here are the steps that I took:
- Sign in to Tableau Public. (If you’re new to Tableau Public, you can create an account here).
- Click on the Explore button in the upper right-hand corner, opening up a web authoring session.
- Make your desired edits. In this case, I put “Estimated population” on the rows shelf, “Age only” on the columns shelf, removed the filter for “Year” and moved it to the Pages shelf so you can just press play to flip through the years.
- Click File > Save As. Give the workbook a name, and click Save, which will save a copy to your own profile. In the example above, you can see that Naledi was automatically credited as the original viz author, the source of my inspiration. I'm also able to mention the source of my inspiration (in this case, Naledi) in the viz description field for additional credit.

With one click, I can dive right into this great visualization, get a better understanding of how it was built, and build my own version crediting the original viz author—all in my browser!
Explore, learn, or build!
Explore is a superb new feature that builds on Tableau Public’s foundations of being a great learning tool. The ability to quickly dig into a visualization in your browser and easily cite the inspiration of the work you’ve built upon is so important for our community to continue to stand on the shoulders of giants. I’m really excited to see what our community does with this feature to enhance our collective learning.
The Tableau Public team is eager to hear your feedback and ideas! Add your ideas to the Community Forums using the tag "tableaupublic."
Storie correlate
Subscribe to our blog
Ricevi via e-mail gli aggiornamenti di Tableau.


