Using the Tableau Extract API to separate facts from opinions
If you’ve watched the recent Pixar hit Inside Out, you might recall the scene where Joy mixes up her facts and opinions.
Joy: “Oh, no, these facts and opinions look so similar.”
Bing Bong: “Ah, don’t worry about it. Happens all the time.”
For those of us who work with data, this scene likely resonated at a deeper level than the rest of the audience. It is our life calling to clearly separate facts from opinions by constantly testing hypothesis with data.
I myself wanted to separate facts from opinions about the weather. Living in Seattle for the past two years, I have been a part of countless conversations about how rainy it is here. I often hear people make comparisons to New York, claiming that “while it feels like it rains a lot here, it actually rains more in New York.” Then why the heck does it seem so rainy here all year long? Plus New Yorkers surely do not complain about the rain as much as Seattleites do!
Are the people of Seattle just soft? If it actually rains more in New York, why does everyone think that Seattle is the most miserably rainy place in the country? I looked to the data to find out.
Using an API to Collect the Data
I used the NOAA API to extract monthly precipitation totals and hourly precipitation measurements from 1980 to 2016.
Why use an API? Tableau's ability to natively connect to so many data sources is amazing. However, data is stored everywhere and there simply cannot be a native connection to all of these unique sources.
This is where the Tableau Extract API comes into play. The Extract API allows users to directly access data in their programming language of choice (in my case, Python). It effectively cuts out the middle man (usually Excel or a database) by directly extracting data in Tableau’s native format.
Getting started with Tableau Extract API
If you're new to APIs, there are a few things you need to follow along. First, you need to install Python and these additional files to use this API. Follow the instructions on this video to complete those steps.
And here's a great tutorial on how to use the API to connect to data.
The key elements of my Python script
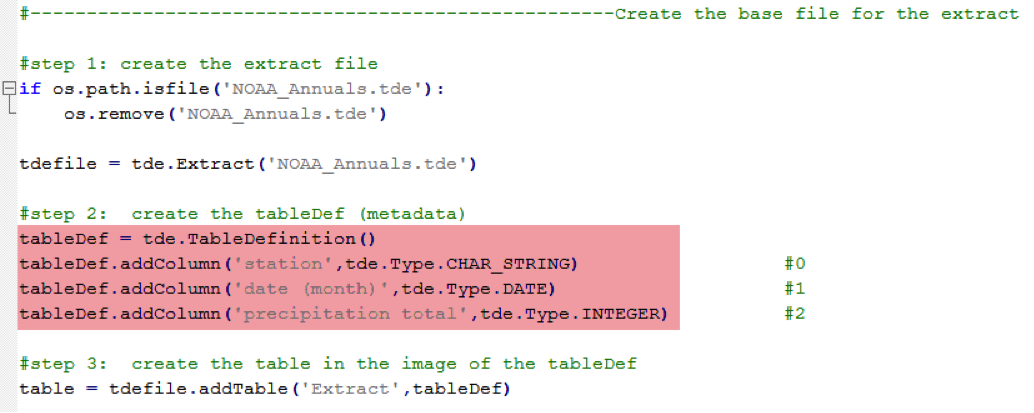
Here are the elements of the Python script I used. The core elements of code for using the Tableau Extract API are creating the table, defining the data types for each column, then loading rows of data into those columns. The highlighted section in this first bit of code is where the data types are assigned for each column 0 through N.

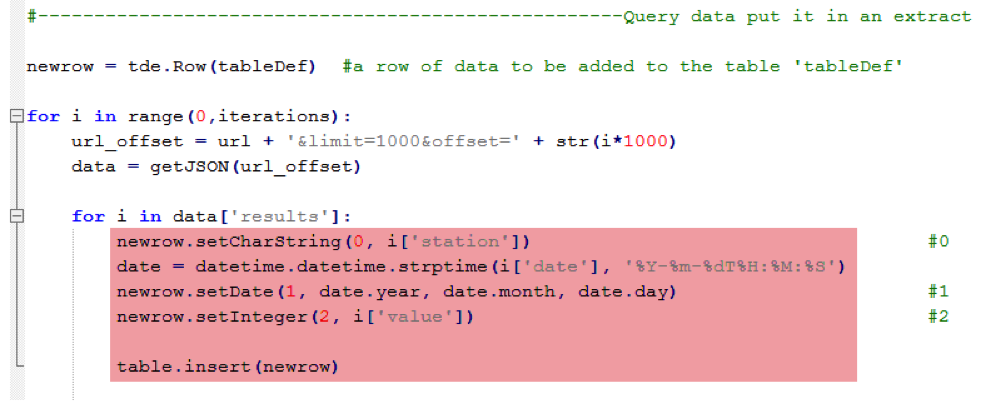
After the table is created, rows of data can be inserted into the table using the “newrow” variable. You can see that date fields are formatted as expected—date, month, day, and all comma-separated.

And the data says…
Now, back to the data. You can easily Google annual rainfall and learn that New York receives an average of ~44 inches compared to Seattle’s ~38 inches. Below are the averages I pulled from the past 26 years using the weather stations plotted below.
When we break down the numbers by month, we can see that New York receives more rain than Seattle except for four months of the year. We have uncovered our first fact: Seattle sees a higher total precipitation from November through February.
Diving in a bit deeper we can see the average hourly precipitation rate. On average, it is always raining harder in New York with the heaviest rain falling in summer months. To the contrary, the rate of rainfall in Seattle is essentially flatlined the entire year. Second fact: It rains significantly harder in New York than it does in Seattle.
This leads me to the question I was most interested in: How does Seattle receive more rainfall in the winter if the rainfall rate is always less than it is in New York? Of course, the answer is frequency. It rains impressively more hours per month in Seattle than it does in New York (except during the summer). In January, Seattle sees an average of ~160 hours with rainfall compared to only ~78 hours in New York. That is 50 percent more hours of the month that see rainfall in Seattle.
So why do people complain about the rainfall in Seattle so often? Because even though it doesn’t get the most rainfall or even the hardest rainfall, Seattle consistently gets rain more often than New York.
The next time I find myself in a pinch while arguing the nuances of Seattle's treacherous rain, I will feel confident in my claims that Seattleites truly are tough, resilient people who can withstand the worst of wet winters. I now have the data—the facts—to back up my opinions.
Storie correlate
Subscribe to our blog
Ricevi via e-mail gli aggiornamenti di Tableau.


