Learn how the Tableau community is using IT data to gain insights that drive decisions
When you use Tableau to see and understand IT data, you start to gain clarity around your infrastructure, software, and resources. Recently, we asked our IT community to share analytics use cases to get insight into how your peers use Tableau.
Here’s what we learned:
- IT organizations are challenged to integrate and blend data from an increasingly large number of platforms and vendors—whether it’s ServiceNow, Jira, or Splunk.
- It is more important to quickly understand what’s happening in the data than to beautify visualizations. Seeing where an issues lies, addressing it, and then building a dashboard to better communicate complicated information leads to bigger impact, faster.
- Tableau dashboards are used as a consolidated monitoring tool for IT organizations. With Tableau, IT users understand what different systems are doing at any given time. This can lead to positive change, e.g. reallocating resources to where there is greater need. This also applies to staffing hours to projects and tickets that are most impactful.
Visit our new IT resource page to explore several interactive IT visualizations, learn from other companies, and watch an interview with Tableau’s IT leadership, showing how we monitor our platforms every day using Tableau.
In this post, we dig into some of our community responses. Let them inspire you to make the most of your business’s IT data, too.
Data from everywhere
IT organizations have data, a lot of data. And keeping applications and services up and running is critical to making sure the rest of the company can do their jobs.
Jeff Strauss, Director of Business Intelligence and Analytics at Conversant Media, uses a variety of data sources including JIRA, Tabmon, Perfmon, TCQA (Total Company Quality Assurance), and Ganglia. Each data source supports its own unique set of responsibilities. For example, with Ganglia, the dashboard Jeff’s team uses has an immediate impact of showing the supply of available queue slots against demand. With it, analysts can plan ahead, deciding what time is best for submitting their ad-hoc queries.
Tim Letona, a software engineer at REI, is getting started on his IT analytics journey. He’s looking to pull ServiceNow data into Tableau to improve visibility for leadership. Specifically, he wants to build dashboards to better understand timecards and project-related costs.
No matter where your data is stored, as an IT professional you can use Tableau to connect to, analyze, and share your IT data across the company—helping give more people insight into the impact you’re providing to the rest of the business.
Dashboards that fuel IT services
With a host of different data sources providing critical information, being able to quickly arrive at insights is what matters most.
At XPO Logistics, Tableau helps Principal Business Intelligence Analyst Justin Larson “identify bottlenecks, sequential dependencies, jobs that are running longer than normal, cycles and patterns in performance, and a few other key metrics. This was the key to knowing where to focus attention for performance, and how to restructure the whole system for quality and clarity.”

In this dashboard, Justin explains, “Most of the gritty detail is in the tooltips. The Average Run times allowed me to spot trends and outliers, and the Gantt was critical for spotting dependencies and bottlenecks. There are a bunch of filters off-screen to select individual servers and jobs, to get closer views.”
By getting all the key IT information in one place, it’s possible to make the best decisions for your organization and its people.
Monitoring systems data
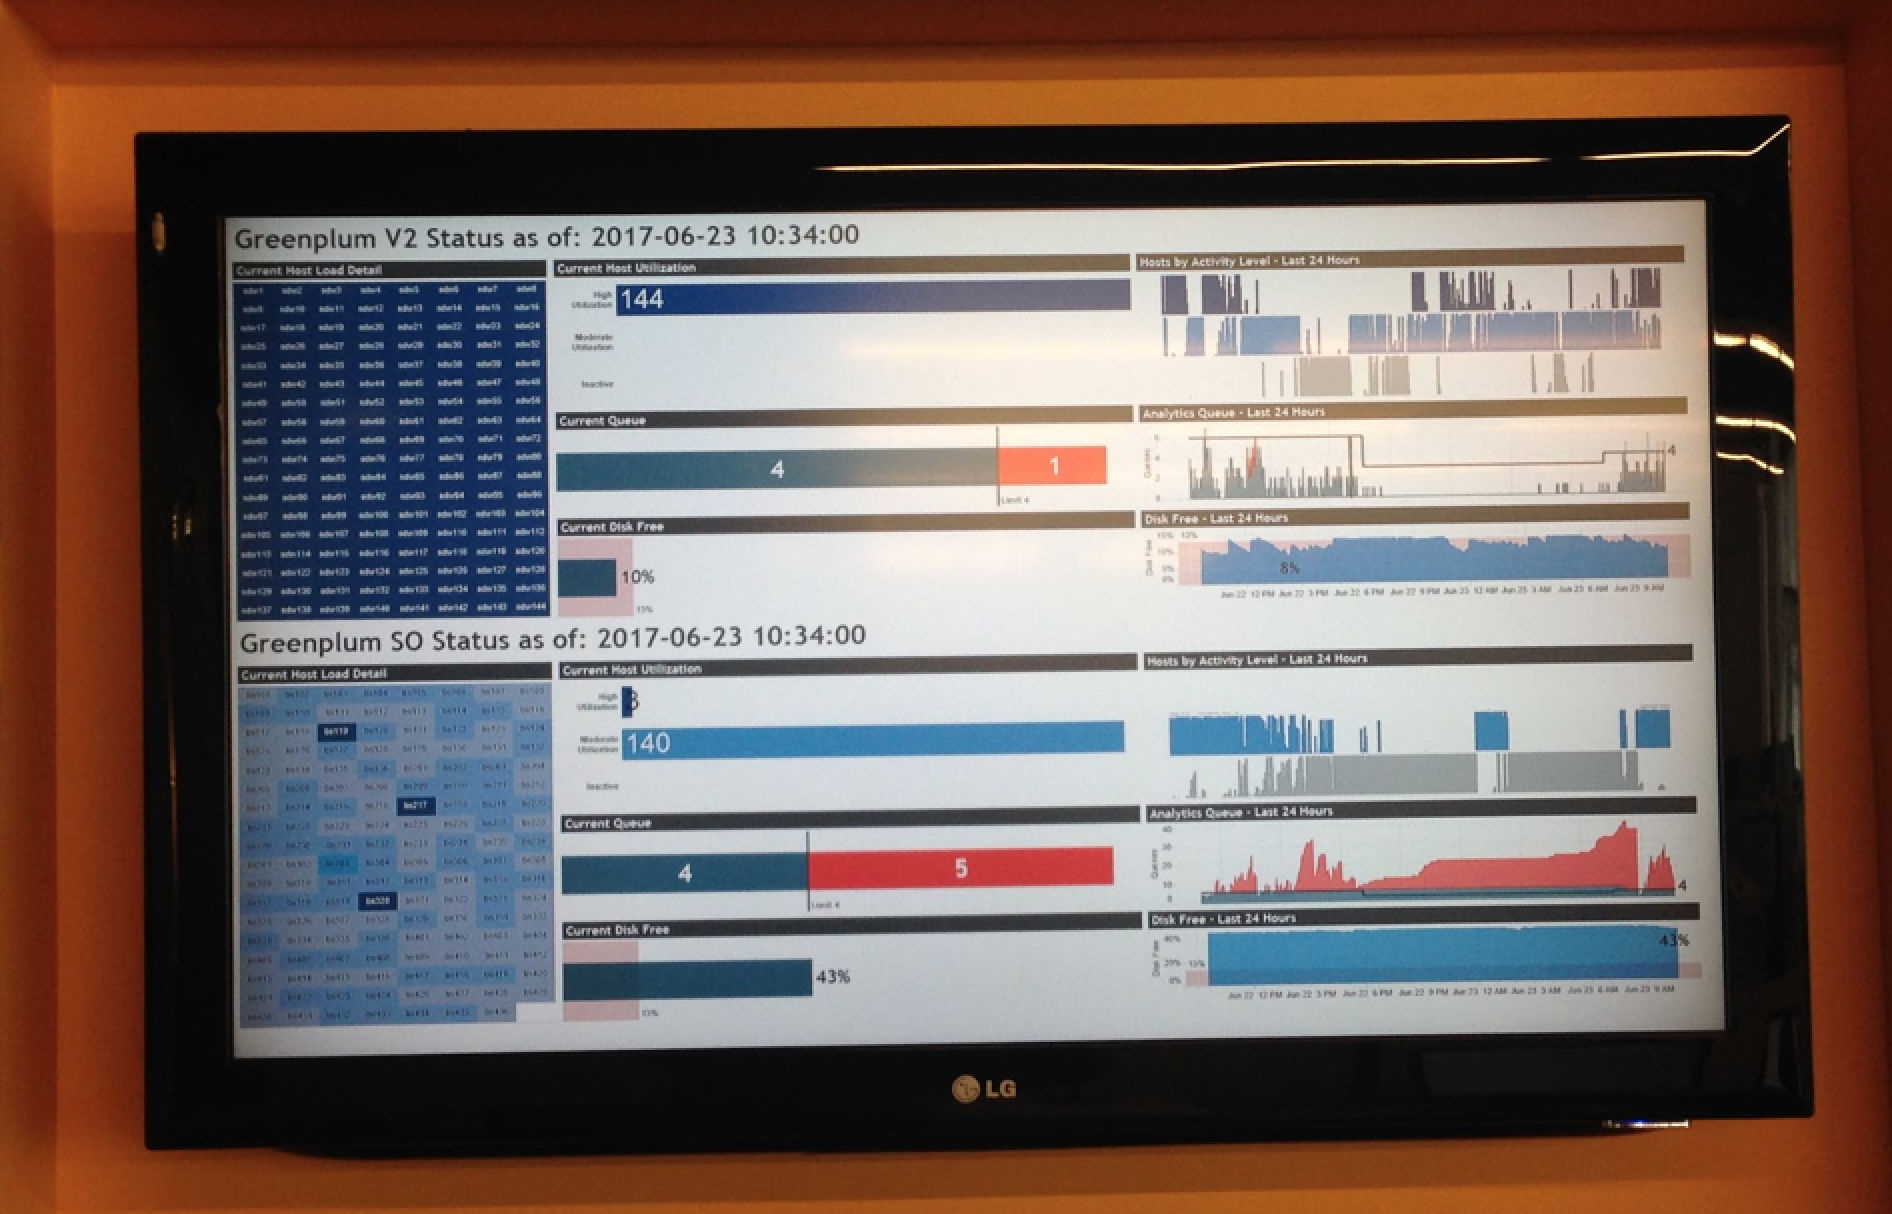
Being able to see what’s going on with various systems that support the company is vital in guaranteeing quality uptime and health. In fact, this visibility is so important that Jeff Strauss actually displays Tableau dashboards on TV monitors throughout his office.

In this Tableau dashboard, treemaps, bar charts, and histograms keep stakeholders up to date about current host utilization, the team’s analytics queue, and free disk space.
With Tableau, the status of the IT department’s data warehouse activities is prominently displayed and shared, so the team can get ahead of issues if something doesn’t look quite right.
What’s next?
To dive deeper, visit The Data of IT resource page, and learn how you can use Tableau to track support tickets, monitor VPN utilization, and allocate budget.
We’ll keep the page up-to-date to make sure that you hear from our customers directly, getting the best Tableau tips and tricks for IT users—including visual best practices, free training videos, case studies, and more.
Be sure to join the conversation, leave a comment, and let us know how you use Tableau in your IT organization, too! We can’t wait to hear from you.
Storie correlate
Subscribe to our blog
Ricevi via e-mail gli aggiornamenti di Tableau.


