Tutte le storie di
 Tableau Research
Digging into Data Landscapes
 26 Ottobre, 2022
Exploring opportunities to facilitate data reconnaissance through automation and visualization.
26 Ottobre, 2022
Exploring opportunities to facilitate data reconnaissance through automation and visualization.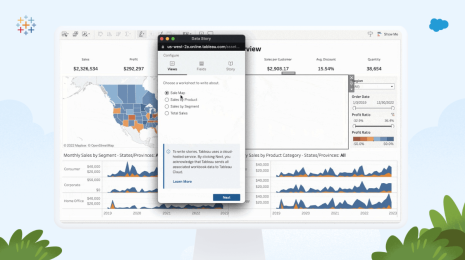 Releases
Inside the Release: Tableau 2022.3 for Analysts and Business Users
 25 Ottobre, 2022
Learn what’s in Tableau 2022.3 for analysts and business users, including Data Guide, Table Extensions, Dynamic Zone Visibility, and more.
25 Ottobre, 2022
Learn what’s in Tableau 2022.3 for analysts and business users, including Data Guide, Table Extensions, Dynamic Zone Visibility, and more. Releases
Ora disponibili in Tableau 2022.3: Guida ai dati, Estensioni delle tabelle, visibilità dinamica sulle zone e altro ancora
 19 Ottobre, 2022
Tableau 2022.3 offre nuove funzionalità che ti consentono di ricavare facilmente informazioni dai tuoi dati, su scala. Tra queste, Guida ai dati, Estensioni delle tabelle, visibilità dinamica sulle zone e altro ancora.
19 Ottobre, 2022
Tableau 2022.3 offre nuove funzionalità che ti consentono di ricavare facilmente informazioni dai tuoi dati, su scala. Tra queste, Guida ai dati, Estensioni delle tabelle, visibilità dinamica sulle zone e altro ancora.
 Visualizations
Exploring Spatial Relationships in Tableau
 13 Ottobre, 2022
Maps are a great tool to visually analyze spatial patterns. In Tableau, it’s simple to add multiple layers of data on top of a custom base map to easily see patterns.
13 Ottobre, 2022
Maps are a great tool to visually analyze spatial patterns. In Tableau, it’s simple to add multiple layers of data on top of a custom base map to easily see patterns. Iron Viz
Hai intenzione di partecipare alle qualificazioni dell'Iron Viz? Ecco come risparmiare tempo
 12 Ottobre, 2022
Impara dai finalisti, dai partecipanti e dai giudici delle edizioni precedenti dell'Iron Viz per gestire nel modo migliore il tempo dedicato alla preparazione delle visualizzazioni da proporre.
12 Ottobre, 2022
Impara dai finalisti, dai partecipanti e dai giudici delle edizioni precedenti dell'Iron Viz per gestire nel modo migliore il tempo dedicato alla preparazione delle visualizzazioni da proporre. Europe, Middle East, Africa
World Food Programme uses data to pivot to pandemic medical response
Pierre Guillaume Wielezynski describes how embedding Tableau dashboards into a new service marketplace enabled the World Food Programme to respond to Covid-19 Community Projects
What is the Tableau Community Project—Back to Viz Basics?
If you’re looking for a fun way to connect with data enthusiasts while also reinforcing foundational data visualization skills, Back to Viz Basics (B2VB)—a Tableau Community Project—is the perfect place to start. Tableau Public
Una guida a Tableau Public per chi inizia
 23 Settembre, 2022
Una guida dettagliata per iniziare il tuo percorso nella visualizzazione dei dati.
23 Settembre, 2022
Una guida dettagliata per iniziare il tuo percorso nella visualizzazione dei dati.
Data Analytics: The Key to Unlocking the Retail Advantage
Data analytics provides retailers with a strong business advantage
 Tableau Community
What is a Data Viz Competition?
 13 Settembre, 2022
Learn about the key elements that make up a Viz Game, or data visualization competition, in which contestants show off their design, analytics, and data storytelling skills.
13 Settembre, 2022
Learn about the key elements that make up a Viz Game, or data visualization competition, in which contestants show off their design, analytics, and data storytelling skills. Partners
3 Tips from Deloitte on Leading a Data Viz Competition with Diversity, Equity and Inclusion
Drawing on the Tableau Iron Viz format, Deloitte’s Viz Games annual data visualization competition helps improve data literacy and strengthen data culture across their organization. Learn three tips on leading a data viz competition at your work—and see the winning vizzes from the teams at Deloitte.
Subscribe to our blog
Ricevi via e-mail gli aggiornamenti di Tableau.