Subject Area: Architecture
Level of complexity: Beginner
Approximate Time to complete: 15 minutes
Companion Workbook (twbx): n/a
Additional Resources on the web:
- http://mission.tableau.com/#/breakthrough-technologies/
- http://onlinehelp.tableau.com/current/pro/online/en-us/help.htm#perf_record_interpret_desktop.html
- http://www.tableau.com/whitepapers/show-me-automatic-presentation-visual-analysis
- http://www.tableau.com/wp/dmr-20080215
VizQL is a visual query language for databases
Simply put, it is the proprietary query language behind the Tableau product suite's visual rendering. It is essentially a translator of SQL queries that traditionally return numbers and tables into an effortless visual analysis. As a user drags and drops data around the Tableau interface, each action generates a query that is subsequently translated into the VizQL language and renders as Tableau visuals.
Because VizQL is a language-based approach, it helps to facilitate 3 important goals that underlie Tableau's design principles: Expressiveness, Incremental Construction, and Alternatives (see page 24 of fourth link above).
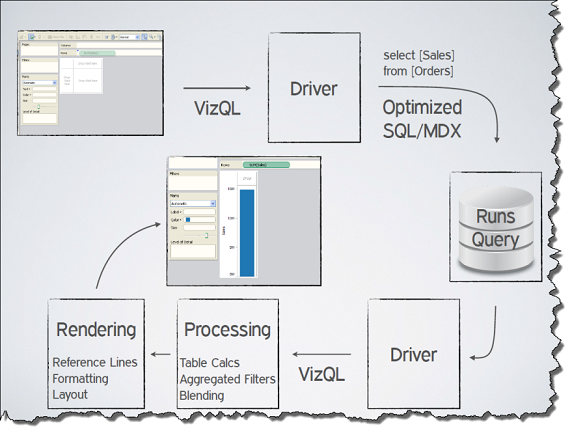
VizQL supports the query and analytics capabilities of standard database query languages, SQL and MDX. It extends these capacities by adding the support for creating visualizations of the results returned from the query. Like the standards, VizQL generates a WHERE clause for filters, an ORDER BY clause for sorting, a GROUP BY clause for controlling level of detail and aggregation, etc. Where VizQL expands upon this, is that it contains a syntax for clearly describing the row and column structure of a table and the resulting visual. It also allows for a user to select a corresponding mark type and to control the visual attributes of those marks. Collectively, the row and column ‘shelves', ‘marks card', and corresponding filters – collectively the VizQL language itself - generates the SQL expression that is sent to the datat source.
As a declarative language, VizQL allows a user to describe ‘what' picture should be created, not necessarily ‘how' to make it. In this way, VizQL is the engine under the hood that makes Tableau go. Any data worker or business user without any prior knowledge of Query Languages can harness the power of their data using Tableau thanks to the VizQL process underneath!
Here is an example of how the architecture for VizQL works, below:

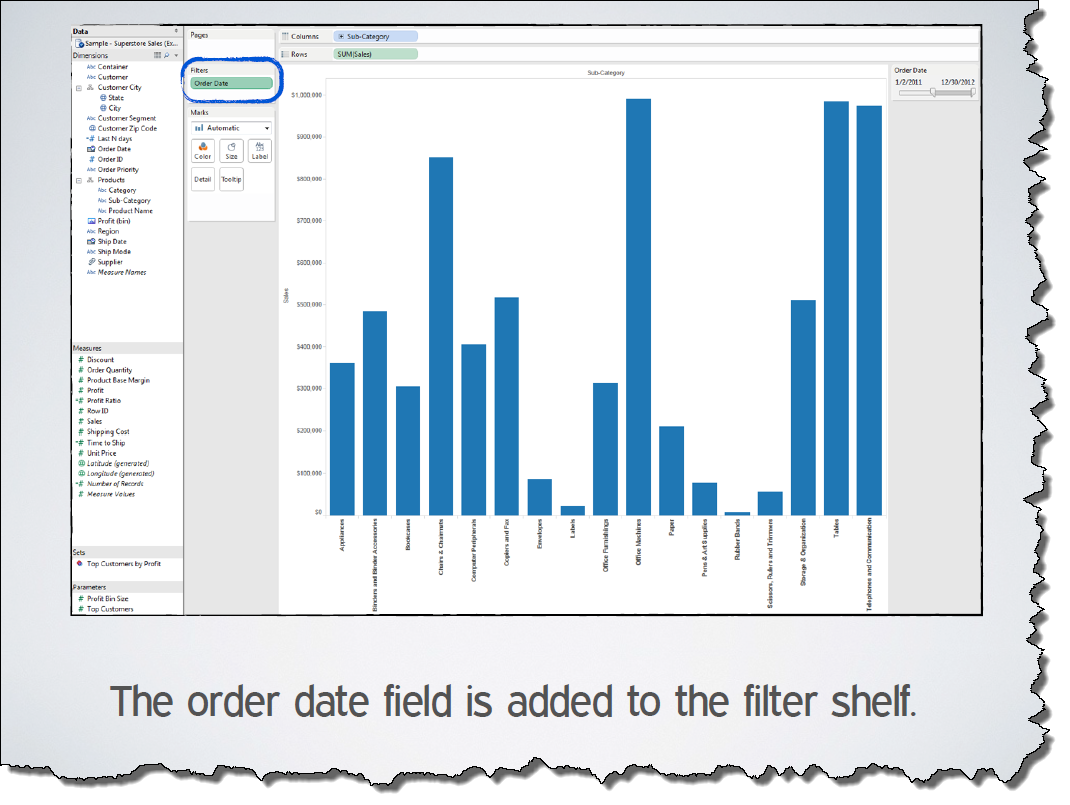
See below for an example of a simple view created in Tableau through several drag-and-drop actions.

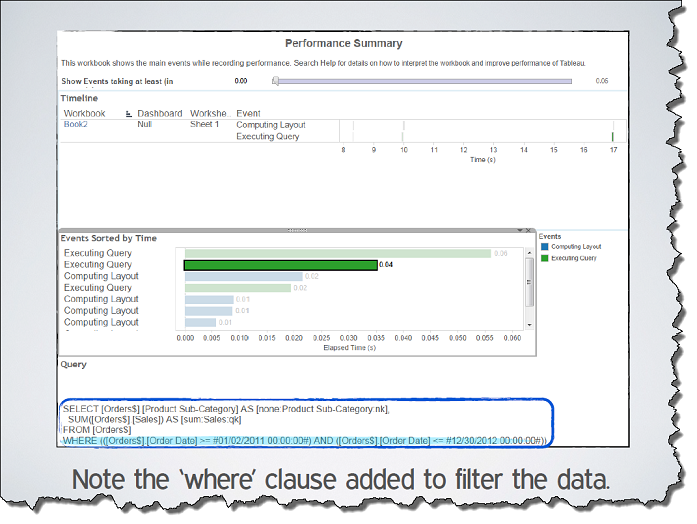
The necessary SQL was compiled automatically and can be viewed in the log files or the performance recorder. See the view from the performance recorder below.

VizQL runs in all Tableau platforms: Tableau Desktop, Server, and Tableau Cloud. It is proprietary to the Tableau Development team and therefore cannot be viewed or customized by a Tableau user.