DataFam Roundup: September 5 - 9, 2022
Welcome! Dig into this week's DataFam Roundup—a weekly blog that brings together community content all in one post. As always, we invite you to send us your content—and the DataFam content from your peers that have inspired you! Find the content submission form here.
DataFam content
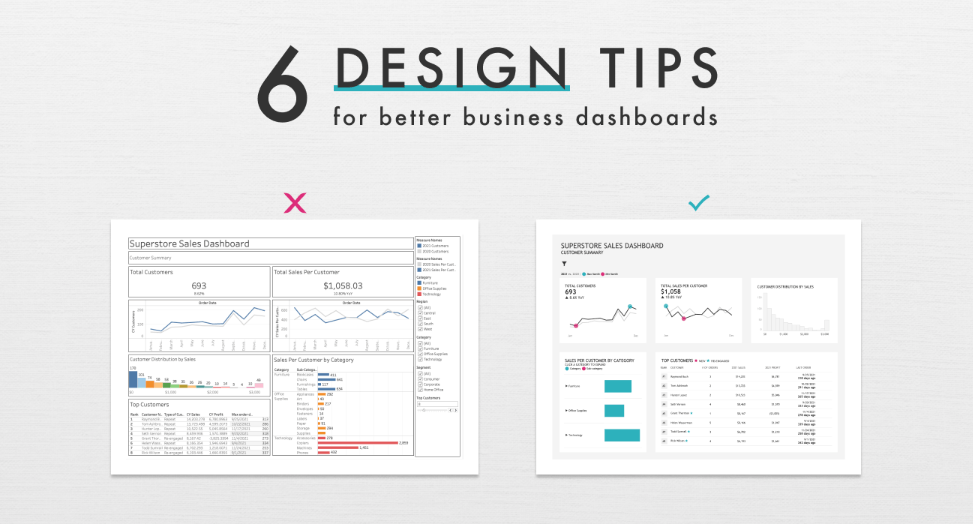
Agata Ketterick, Lovelytics: 6 Design Tips for Better Business Dashboards in Tableau
Dive into content created by the Tableau Community:
-
Jason Khu: UNSW students learn Tableau and create a data story in 2 days – 2022 Dataviz Hackathon Recap
-
Will Sutton: Will's Iron Viz Training Montage - The Director's Cut, Iron Viz 2022
-
Andy Kriebel: What are Date Functions in Tableau?
-
Techi Anshi: How to Freeze Pane in Tableau
-
Pablo Gomez:
-
Chimdi Nwosu, Nightingale: SPOTLIGHT: W.E.B. Du Bois Portrait Gallery, Nightingale
-
Donabel Santos, Sqlbelle: What the “Tableau Ambassador” means to me
-
Dawn Harrington, Tech Tips Girl: How to Create a Dendrogram Chart
-
Adam Korengold, Nightingale: Insights Of Their Own: Visualizing Women’s Baseball, Nightingale
-
Ken Flerlage and Kizley Benedict, The Flerlage Twins: How to Create a Gradient Area Chart in Tableau (Kizley Benedict)
-
Agata Ketterick, Lovelytics: 6 Design Tips for Better Business Dashboards in Tableau
-
Brian Graves: Use This Exact Checklist To Know When You're Ready To Start Applying To Your First Data Analyst Job
-
Mark Bradbourne, Just 5 Minutes: "Let me drive you to Pittsburgh"
Team Tableau
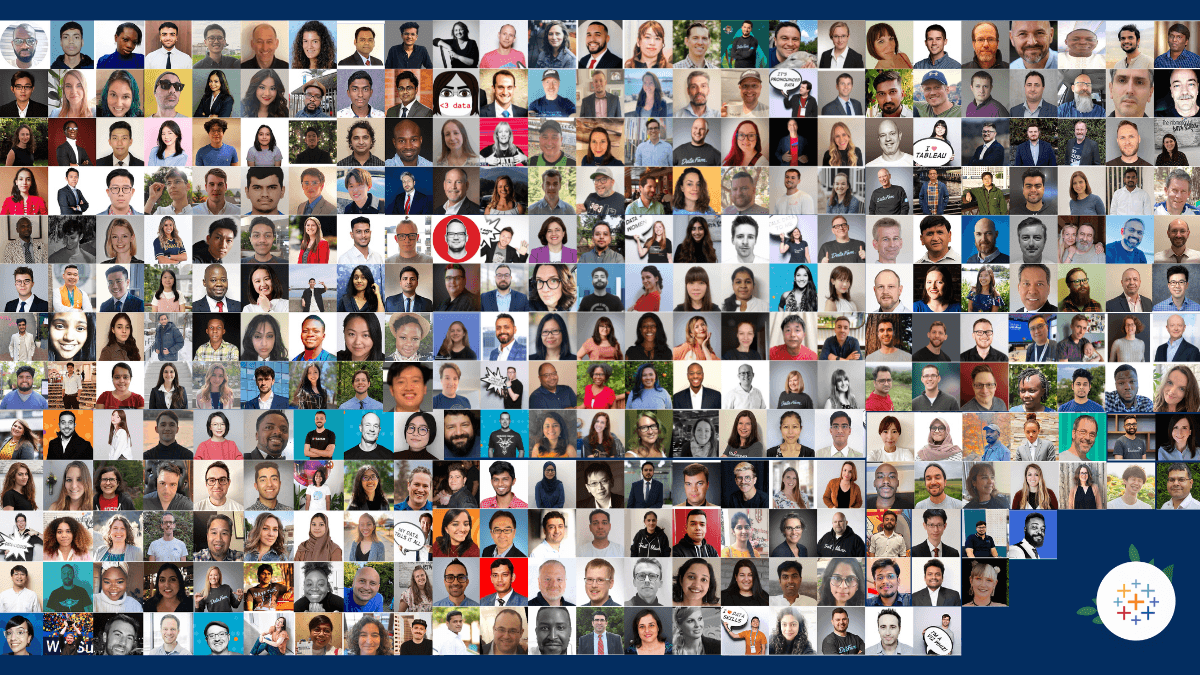
 Headshots of 2022 Tableau Ambassadors
-
Re-Viz-it the Tableau Public Homepage to Discover What’s New
-
Learning Tableau Helped Me Land My Dream Job in the Music Tech Industry
Upcoming events and community participation
-
Create your first viz (dashboard) in Tableau! After two long years, no thanks to the pandemic, **WeVisualize** is back with our in-person sessions and happy to kick things off by going **back to the basics!**
- Stay up to date with the latest and greatest from the Tableau Community. We'll help you along in your Tableau journey, bring your data skills to the next level, and nurture powerful connections.
- Sign up to be a panelist for the 3charts@3 Live: A Mystery Chart Show featuring topics like personal finance, energy, healthcare and more!
Vizzes
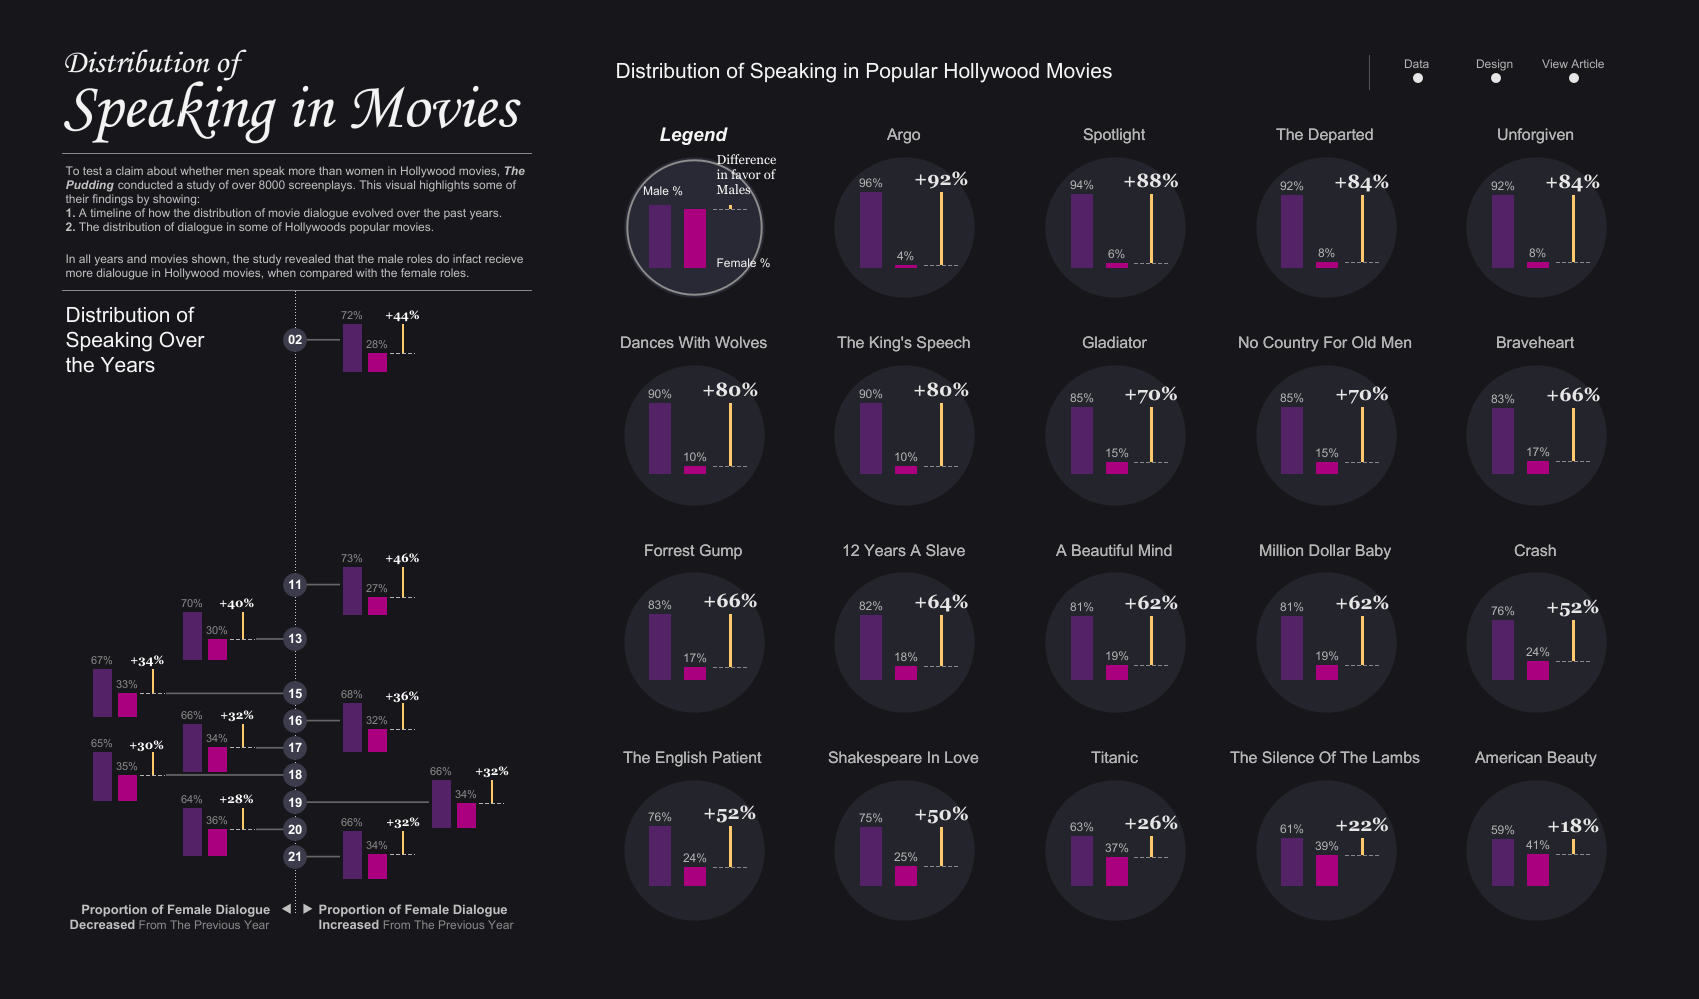
- Chimdi Nwosu: #DiversityinData - Distribution of Speaking in Movies
See the latest Viz of the Day, trending vizzes, featured authors, and more on Tableau Public.
Check out some inspirational vizzes created by the community:
- Will Sutton: The Soundtrack to my Pokemon Yellow Journey | #DataPlusMusic #GamesNightViz
- Dima Ghattas: Canada Viz Games 2022
- Chimdi Nwosu: #DiversityinData - Distribution of Speaking in Movies
- Nurudeen A: Military Spending in Africa
- Kashish Rastogi: The Magical World Of Star Wars
Community Projects
Back 2 Viz Basics
A bi-weekly project helping those who are newer in the community and just starting out with Tableau. Not limited just to newbies!
Web: Back 2 Viz Basics
Twitter: #B2VB
Week 19: Use an Action
Workout Wednesday
Build your skills with a weekly challenge to re-create an interactive data visualization.
Web: Workout Wednesday
Twitter: #WOW2022
Week 36: Let’s build a Marrimeko Chart
Workout Wednesday
A weekly social data project.
Web: Makeover Monday
Twitter: #MakeoverMonday
Week 36: Median Age of First Marriages
Preppin' Data
A weekly challenge to help you learn to prepare data and use Tableau Prep.
Web: Preppin’ Data
Twitter: #PreppinData
Week 36: Calendar Conundrum
DataFam Con
A monthly challenge covering pop culture and fandoms.
Web: DataFam Con
Twitter: #DataFamCon
September 2022: Lord of the Rings
EduVizzers
A monthly project connecting real education data with real people.
Web: Eduvizzers
September 2022: Detailed Years of School Completed by People 25 Years and Over by Sex, Age Groups, Race and Hispanic Origin: 2021
Games Night Viz
A monthly project focusing on using data from your favorite games.
Web: Games Nights Viz
Twitter: #GamesNightViz
August 2022: The Tour: The Sound of Games with #DataPlusMusic
Iron Quest
Practice data sourcing, preparation, and visualization skills in a themed monthly challenge.
Web: Iron Quest
Twitter: #IronQuest
August 2022: The Tour: The Sound of Games with #DataPlusMusic
Public Policy Viz
Bridging the gap between analytics professionals and policy practitioners.
Web: Public Policy Viz
Twitter: #PublicPolicyViz
Project 1: Redlining in Pittsburgh, PA
Data Plus Music
A monthly project visualizing the data behind the music we love!
Web: Data Plus Music
Twitter: #DataPlusMusic
July 2022: The Intro
Storytelling with Data
Practice data visualization and storytelling skills by participating in monthly challenges and exercises.
Web: Storytelling with Data
Twitter: #SWDChallenge
September 2022: known to novel
Project Health Viz
Uncover new stories by visualizing healthcare data sets provided each month.
Web: Project Health Viz
Twitter: #ProjectHealthViz
August 2022: Mental Health Care Professionals Shortages
Diversity in Data
An initiative centered around diversity, equity & awareness by visualizing provided datasets each month.
Web: Diversity in Data
Twitter: #DiversityinData
September 2022: Global Women
Sports Viz Sunday
Create and share data visualizations using rich, sports-themed data sets in a monthly challenge.
Web: Sports Viz Sunday
Twitter: #SportsVizSunday
August 2022: Commonwealth Games
Viz for Social Good
Volunteer to design data visualizations that help nonprofits harness the power of data for social change.
Web: Viz for Social Good
Twitter: #VizforSocialGood
Sept 2-Sept 30 2022: India Water Portal/Arghyam
Real World Fake Data
Create business dashboards using provided data sets for various industries and departments.
Web: Real World Fake Data
Twitter: #RWFD
Session 3: Community Service Requests
SDG Viz Project
Visualize data about Sustainable Development Goals provided by the World Health Organization.
Web: SDG Viz Project
Twitter: #TheSDGVizProject
Autres sujets pertinents
Abonnez-vous à notre blog
Recevez toute l'actualité de Tableau.


