DataFam Roundup: October 3-7, 2022
Welcome! Dig into this week's DataFam Roundup—a weekly blog that brings together community content all in one post. As always, we invite you to send us your content—and the DataFam content from your peers that have inspired you! Find the content submission form here.
DataFam content
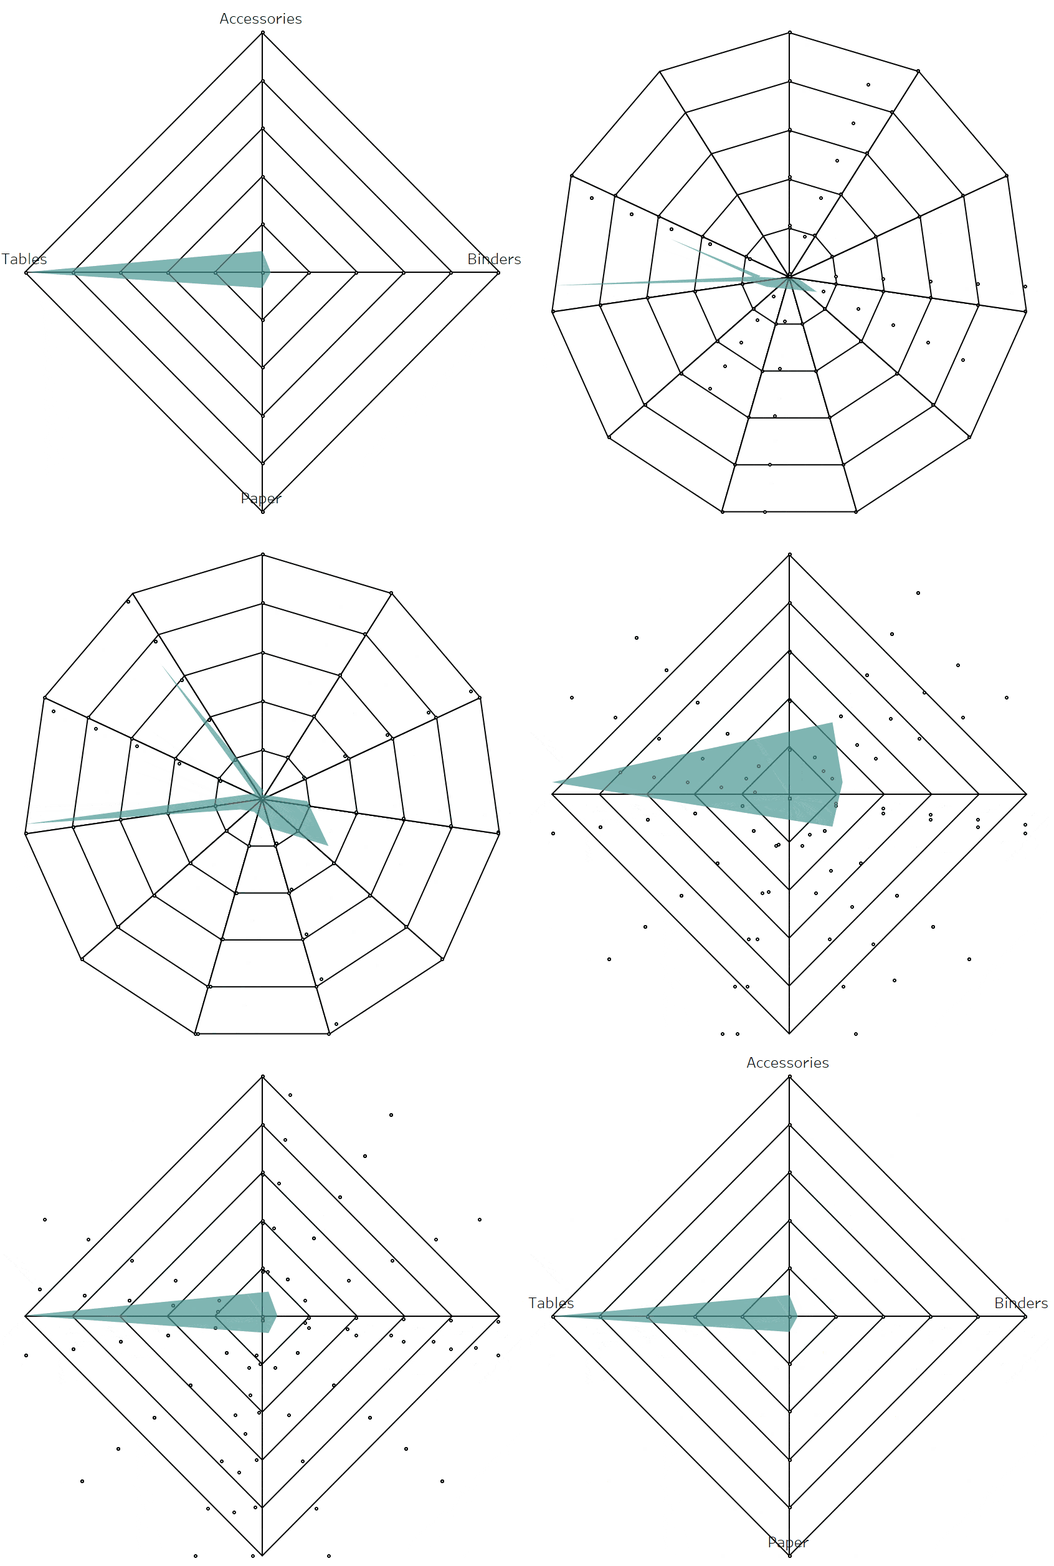
Dan Bunker, Playfair Data: How to Create a Dynamic Spider Web Background for Radar Charts
Dive into content created by the Tableau Community:
-
Vignesh Suresh: Create a Tree-Map Bar Chart
-
Will Sutton:
-
Brian Moore, Do Mo(o)re with Data: KPI Swapping with BAN Selectors
-
Darragh Murray: Down With Tadpoles, Up With Arrows | The Superiority of the Arrow Chart
-
Dan Bunker, Playfair Data: How to Create a Dynamic Spider Web Background for Radar Charts
-
Andy Kriebel, VizWiz: How to Create a Starburst Chart
-
Dual Axis Podcast: Why we have too few women in tech & what we can do about it
-
-
Zach Bowders, Data + Love: Brittany Rosenau
-
CJ Mayes: What’s Good? How To Improve Your Story Telling with Kimly Scott (October)
-
Klaus Schulte: One-Sheet Marginal Histograms - VIZJOCKEY.com | CO data
-
Rosario Gauna, Rosario Viz: Can you Build a Map with values represented by “Pyramids”?
Team Tableau
- Iron Viz Qualifiers are open until October 30, 2022. Learn about the theme and get vizzing.
- Tableau Forums Ambassador Spotlight: Budi Lubis
- What’s New with Tableau User Groups
- What is the Tableau Community Project—Back to Viz Basics?
- Featured Authors: Back to School Edition
Upcoming events and community participation
-
2023 Iron Viz Qualifier Kickoff Events: Join previous Iron Viz champions and participants for tips, best practices and contest details for the 2023 Iron Viz Qualifier competition. Remember, win or learn - you can't lose.
-
October 15th 2022 #OneCommunity Hangout Registration on Remo: Organized by Tableau Visionary Adam Mico, the purpose is a meetup and hangout in a relaxing atmosphere with no more than eight people per table and a chance to move around and meet many people in our greater community.
-
Create your first viz (dashboard) in Tableau! After two long years, no thanks to the pandemic, **WeVisualize** is back with our in-person sessions and happy to kick things off by going **back to the basics!**
- Stay up to date with the latest and greatest from the Tableau Community. We'll help you along in your Tableau journey, bring your data skills to the next level, and nurture powerful connections.
- Sign up to be a panelist for the 3charts@3 Live: A Mystery Chart Show featuring topics like personal finance, energy, healthcare and more!
Vizzes

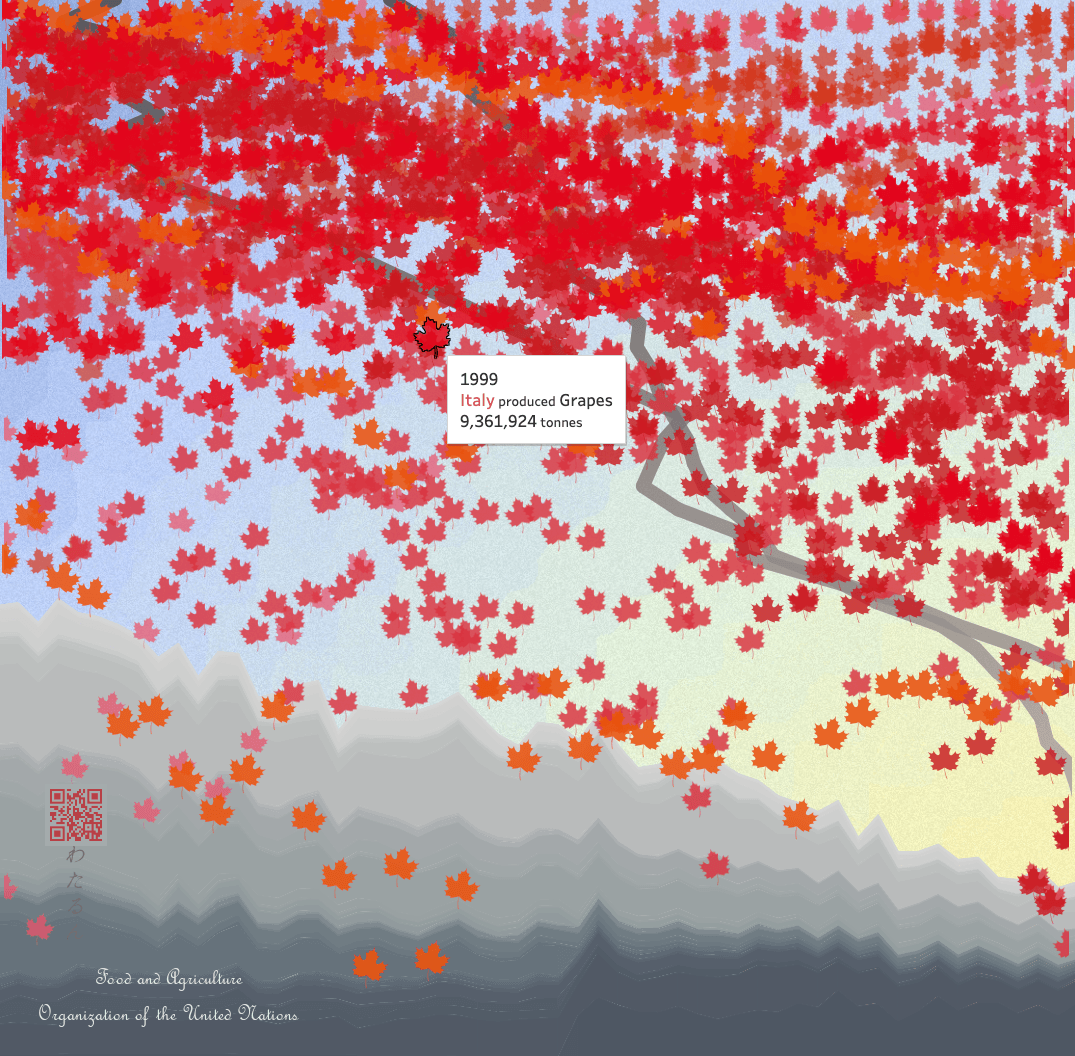
Wataru Kawaguchi(Watarun): Autumn Fruit Tart
See the latest Viz of the Day, trending vizzes, featured authors, and more on Tableau Public.
Check out some inspirational vizzes created by the community:
- Sam Epley: Tableau Public Featured Authors: Back to School Edition - September 2022 Cohort
- Zach Bowders: Shitshow!
- Chimdi Nwosu: #RWFD - NYC Community Service Requests
- Adekola Aliu: ASUU strike
- Kim Tricker: 2022 Data Science Salaries
- Wataru Kawaguchi(Watarun): Autumn Fruit Tart
Community Projects
Back 2 Viz Basics
A bi-weekly project helping those who are newer in the community and just starting out with Tableau. Not limited just to newbies!
Web: Back 2 Viz Basics
Twitter: #B2VB
Week 20: Change Over Time
Workout Wednesday
Build your skills with a weekly challenge to re-create an interactive data visualization.
Web: Workout Wednesday
Twitter: #WOW2022
Week 40: Applying Accessibility Principles to Data Visualization
Makeover Monday
A weekly social data project.
Web: Makeover Monday
Twitter: #MakeoverMonday
Week 40: Truss to push ahead with low-tax economy despite calls for caution
Preppin' Data
A weekly challenge to help you learn to prepare data and use Tableau Prep.
Web: Preppin’ Data
Twitter: #PreppinData
Week 40: Times Tables
DataFam Con
A monthly challenge covering pop culture and fandoms.
Web: DataFam Con
Twitter: #DataFamCon
October 2022: Stranger Things + Music Nostalgia Month
EduVizzers
A monthly project connecting real education data with real people.
Web: Eduvizzers
September 2022: Detailed Years of School Completed by People 25 Years and Over by Sex, Age Groups, Race and Hispanic Origin: 2021
Games Night Viz
A monthly project focusing on using data from your favorite games.
Web: Games Nights Viz
Twitter: #GamesNightViz
September 2022: Montages
Iron Quest
Practice data sourcing, preparation, and visualization skills in a themed monthly challenge.
Web: Iron Quest
Twitter: #IronQuest
August 2022: The Tour: The Sound of Games with #DataPlusMusic
Public Policy Viz
Bridging the gap between analytics professionals and policy practitioners.
Web: Public Policy Viz
Twitter: #PublicPolicyViz
Project 1: Redlining in Pittsburgh, PA
Data Plus Music
A monthly project visualizing the data behind the music we love!
Web: Data Plus Music
Twitter: #DataPlusMusic
July 2022: The Intro
Storytelling with Data
Practice data visualization and storytelling skills by participating in monthly challenges and exercises.
Web: Storytelling with Data
Twitter: #SWDChallenge
September 2022: known to novel
Project Health Viz
Uncover new stories by visualizing healthcare data sets provided each month.
Web: Project Health Viz
Twitter: #ProjectHealthViz
August 2022: Mental Health Care Professionals Shortages
Diversity in Data
An initiative centered around diversity, equity & awareness by visualizing provided datasets each month.
Web: Diversity in Data
Twitter: #DiversityinData
September 2022: Global Women
Sports Viz Sunday
Create and share data visualizations using rich, sports-themed data sets in a monthly challenge.
Web: Sports Viz Sunday
Twitter: #SportsVizSunday
August 2022: Commonwealth Games
Viz for Social Good
Volunteer to design data visualizations that help nonprofits harness the power of data for social change.
Web: Viz for Social Good
Twitter: #VizforSocialGood
Sept 2-Sept 30 2022: India Water Portal/Arghyam
Real World Fake Data
Create business dashboards using provided data sets for various industries and departments.
Web: Real World Fake Data
Twitter: #RWFD
Session 3: Community Service Requests
SDG Viz Project
Visualize data about Sustainable Development Goals provided by the World Health Organization.
Web: SDG Viz Project
Twitter: #TheSDGVizProject
Autres sujets pertinents
Abonnez-vous à notre blog
Recevez toute l'actualité de Tableau.


