DataFam Roundup: November 28 - December 2, 2022
Welcome! Dig into this week's DataFam Roundup—a weekly blog that brings together community content all in one post. As always, we invite you to send us your content—and the DataFam content from your peers that have inspired you! Find the content submission form here.
DataFam content
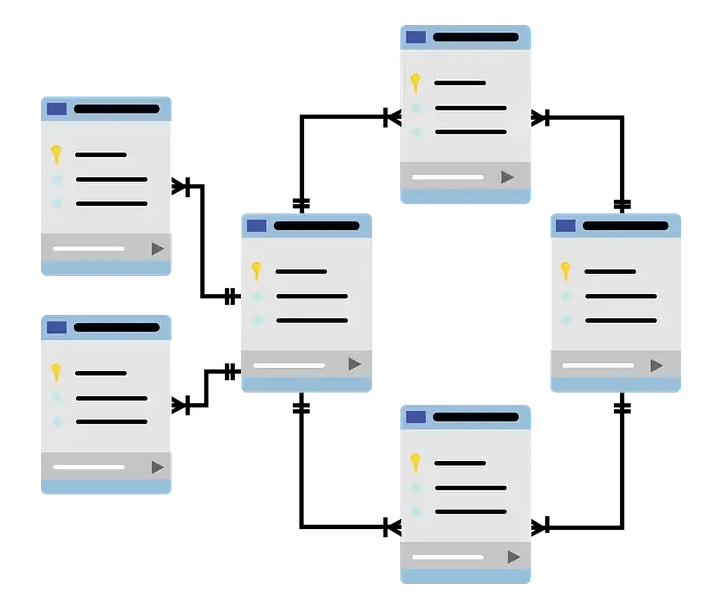
Iko Tumangan: How would you describe a Tableau Relationship?
Dive into content created by the Tableau Community:
-
Jenny Martin and Carl Allchin: Prep Recipes
-
Johnathan Barnard, Data Leadership Collaborative: 5 Ways to Build Employee Engagement, Happiness, and Personal Growth in a Digital Era
-
Allan Murray: Top Tableau Jobs 21 November 2022
-
Sarah Battersby, CO-data: Converting NetCDF files to .hyper for use in Tableau
-
Katie Kilroy, datakatie: How to Anonymize Your Data for the Tableau Community Forums
-
Steve Adams, VizDJ: Top 10 Series of Tableau Blogs - Tableau Training
-
Deepak Holla: Quick summary of the terms Dimensions, Measures, Discrete, Continuous, Blue and Green in Tableau
-
Christian Silva and Marc Montanari, The Data Coffee Break Podcast: Welcome to the Alternative Data with Alex Lokhov - The Data Coffee Break Podcast
-
Andy Kriebel:
-
Sarah Bartlett, Sarah Loves Data: Iron Quest – Weird or Wonderful
-
Tim Ngwena, Tableau Tim: Everybody's Introduction to Tableau
-
Brian Moore: Do Mo(o)re With Data: Gradient Chord Chart
-
Autumn Battani, The Flerlage Twins: Spicy Tables - Freeze a Row & Compare All Other Rows
-
Mateusz Zajac: Tableau: Groups vs Sets
-
Alaa A: How to Turn Boring Visualization into Fascinating Data Storytelling.
-
Iko Tumangan: How would you describe a Tableau Relationship?
-
Dawn Harrington, Tech Tips Girl: To Gauge or Not to Gauge
Team Tableau
Upcoming events and community participation
-
#TableauNext Nominee Form | 2023: Led by Tableau Visionary Adam Mico, #TableauNext is a list of people newer to the community who are not yet Visionaries or Ambassadors, but have been doing incredible work. If their contributions are in a language other than English, please explain why their contributions be included (as I only speak English). The results will be listed alphabetically and shared on my blog at https://adammico.medium.com/. Share who you think should be considered in #TableauNext.
Vizzes
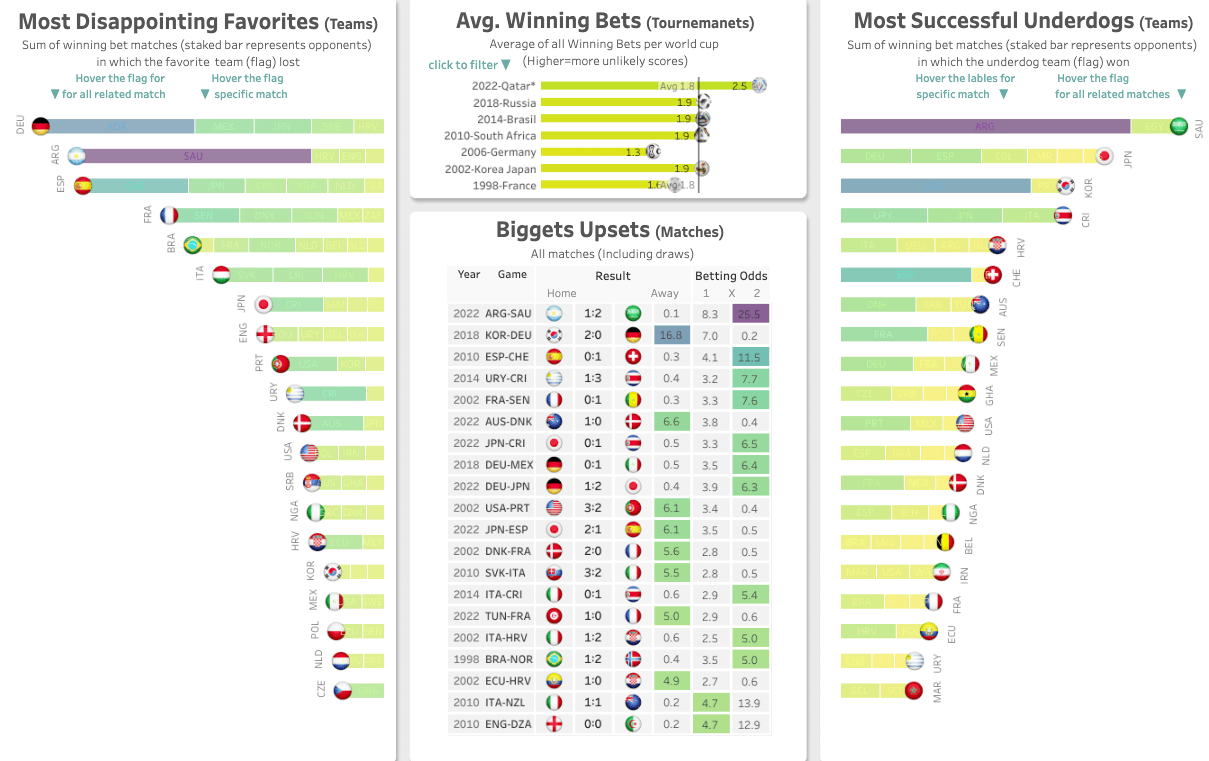
Nir Smilga: World Cup Biggest Upsets #Sport #Soccer #Fifa #Worldcup #World_Cup
See the latest Viz of the Day, trending vizzes, featured authors, and more on Tableau Public.
Check out some inspirational vizzes created by the community:
- Nir Smilga: World Cup Biggest Upsets #Sport #Soccer #Fifa #Worldcup #World_Cup
- Annabelle Rincon: Christmas Calendar 2022
- Nicole Mark: The U.S. must enact gun reform now | #MakeoverMonday 2022 Week 48
-
Irene Strodel: Thanksgiving Football Games #B2VB
Community Projects
Back 2 Viz Basics
A bi-weekly project helping those who are newer in the community and just starting out with Tableau. Not limited just to newbies!
Web: Back 2 Viz Basics
Twitter: #B2VB
Week 24: Build a Bar Chart II or Scatter Plot II
Workout Wednesday
Build your skills with a weekly challenge to re-create an interactive data visualization.
Web: Workout Wednesday
Twitter: #WOW2022
Week 48: Can you do this in ONE dashboard?
Makeover Monday
A weekly social data project.
Web: Makeover Monday
Twitter: #MakeoverMonday
Week 48: US School Shootings K-12
Preppin' Data
A weekly challenge to help you learn to prepare data and use Tableau Prep.
Web: Preppin’ Data
Twitter: #PreppinData
Week 48: Tiddlywinks Tidy
DataFam Con
A monthly challenge covering pop culture and fandoms.
Web: DataFam Con
Twitter: #DataFamCon
November 2022: Don’t blink, or you’ll miss traveling through space & time.. and data!
EduVizzers
A monthly project connecting real education data with real people.
Web: Eduvizzers
November 2022: Student Loan Borrowing and Repayment
Games Night Viz
A monthly project focusing on using data from your favorite games.
Web: Games Nights Viz
Twitter: #GamesNightViz
October 2022: IronViz Edition: Tips from the Team
Iron Quest
Practice data sourcing, preparation, and visualization skills in a themed monthly challenge.
Web: Iron Quest
Twitter: #IronQuest
November 2022: Weird or Wonderful
Public Policy Viz
Bridging the gap between analytics professionals and policy practitioners.
Web: Public Policy Viz
Twitter: #PublicPolicyViz
Project 1: Redlining in Pittsburgh, PA
Data Plus Music
A monthly project visualizing the data behind the music we love!
Web: Data Plus Music
Twitter: #DataPlusMusic
July 2022: The Intro
Storytelling with Data
Practice data visualization and storytelling skills by participating in monthly challenges and exercises.
Web: Storytelling with Data
Twitter: #SWDChallenge
November 2022: comedic charts
Project Health Viz
Uncover new stories by visualizing healthcare data sets provided each month.
Web: Project Health Viz
Twitter: #ProjectHealthViz
August 2022: Mental Health Care Professionals Shortages
Diversity in Data
An initiative centered around diversity, equity & awareness by visualizing provided datasets each month.
Web: Diversity in Data
Twitter: #DiversityinData
September 2022: Global Women
Sports Viz Sunday
Create and share data visualizations using rich, sports-themed data sets in a monthly challenge.
Web: Sports Viz Sunday
Twitter: #SportsVizSunday
October 2022: Row, row, row your boat
Viz for Social Good
Volunteer to design data visualizations that help nonprofits harness the power of data for social change.
Web: Viz for Social Good
Twitter: #VizforSocialGood
Sept 2-Sept 30 2022: India Water Portal/Arghyam
Real World Fake Data
Create business dashboards using provided data sets for various industries and departments.
Web: Real World Fake Data
Twitter: #RWFD
Session 3: Community Service Requests
SDG Viz Project
Visualize data about Sustainable Development Goals provided by the World Health Organization.
Web: SDG Viz Project
Twitter: #TheSDGVizProject
Autres sujets pertinents
Abonnez-vous à notre blog
Recevez toute l'actualité de Tableau.


