DataFam Roundup: November 1 - 5, 2021
Dig into the latest DataFam Roundup—a weekly blog that brings together community content all in one post. As always, we invite you to send us your content—and the DataFam content from your peers that have inspired you! Find the content submission form here.
DataFam content
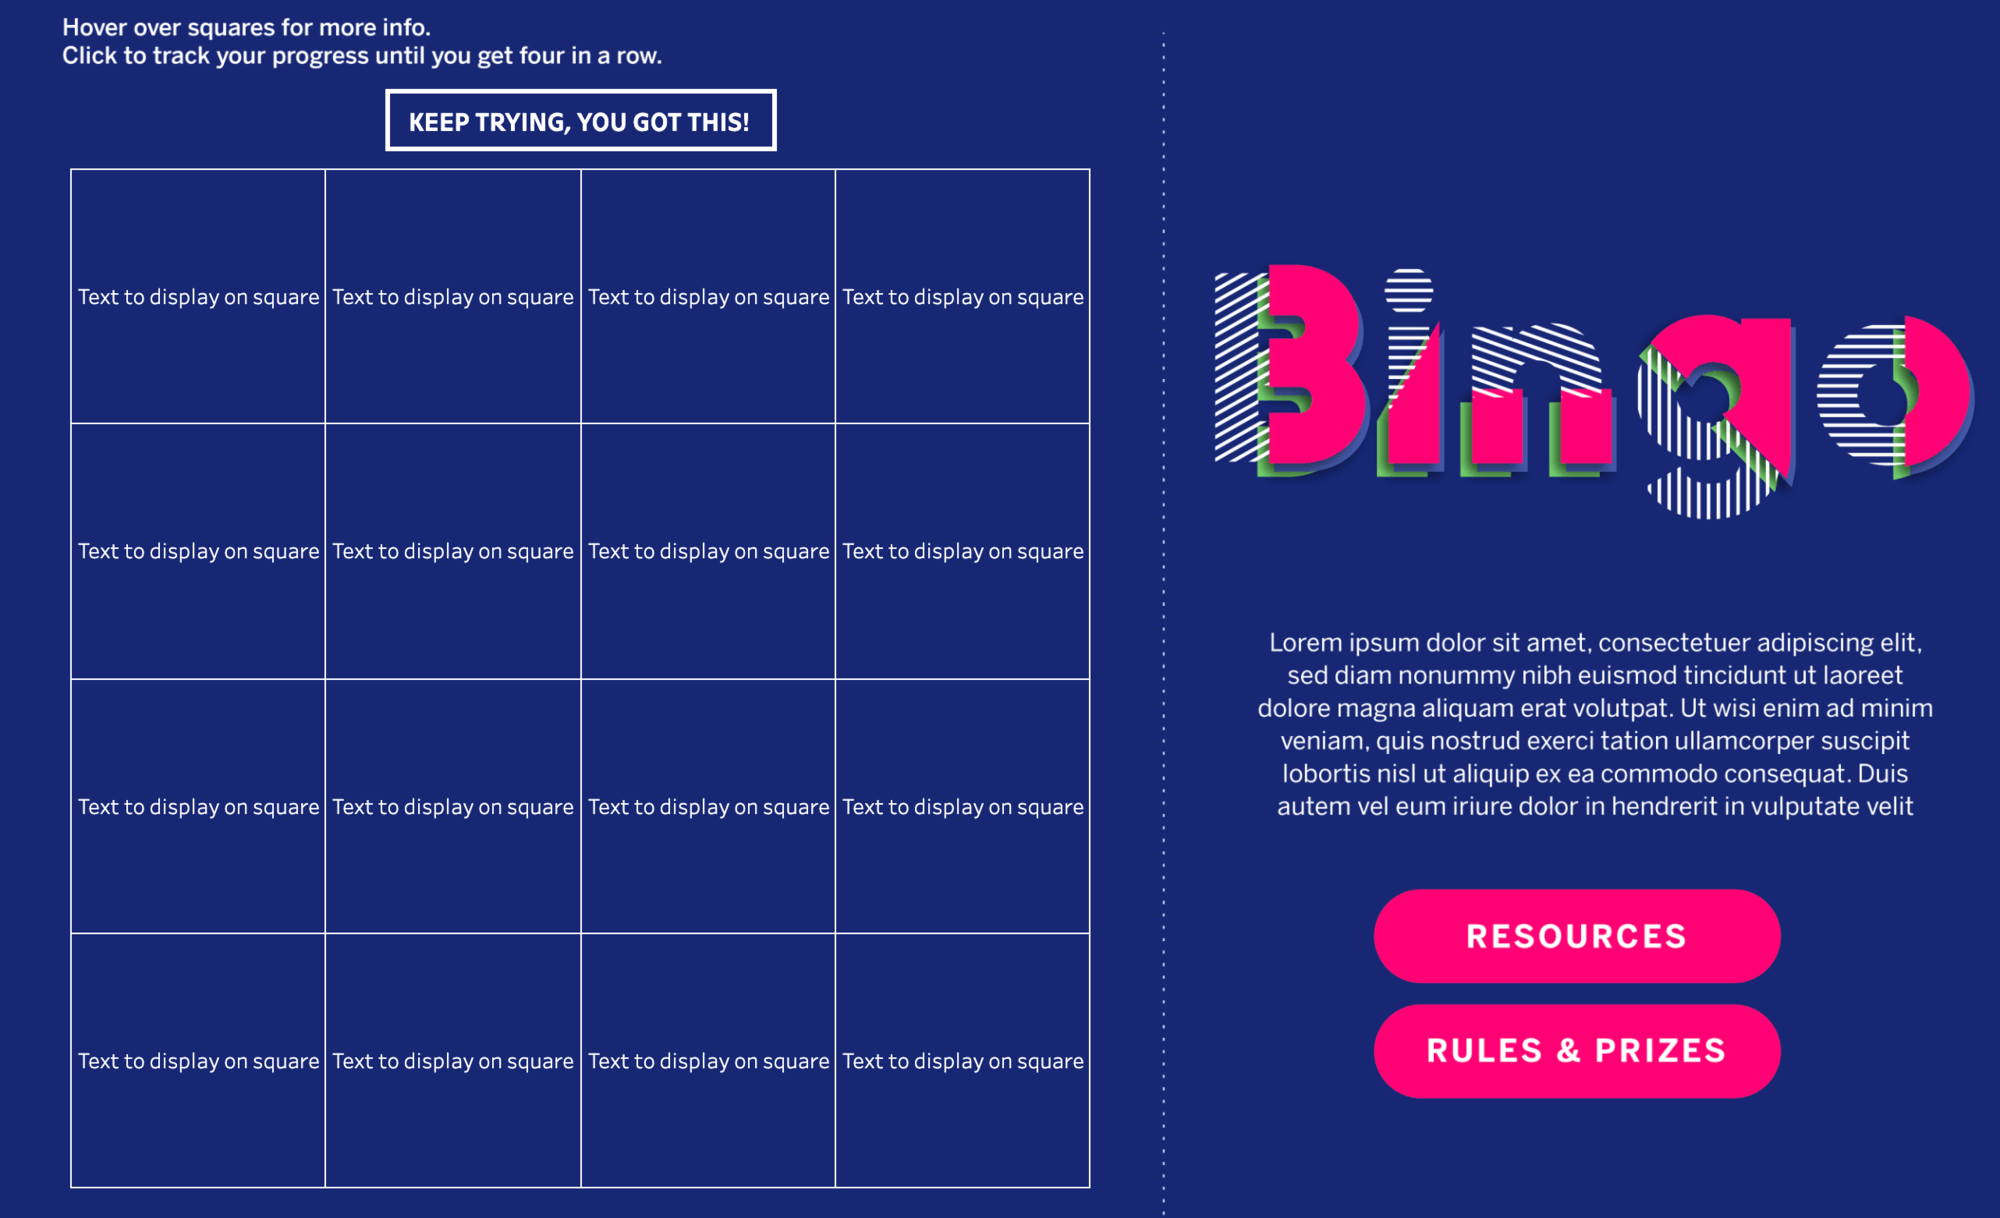
Autumn Battani, Make It Make Sense: B-I-N-G-O Template
Dive into content created by the Tableau Community:
- Irene Diomi, The Information Lab: Combining Figma and Tableau
- Simon Beaumont, Sports Viz Sunday: Announcing our new #SportsVizSunday Team Roster
- Marc Reid, datavis.blog: Visualising Floor Plan Data in Tableau
- Diversity in Data: Coming up! What you can expect from Diversity in Data for the rest of the year
- Jim Dehner: FAQ Series - Drilling down in Top N and Other
- Satoshi Ganeko: Understanding Join, Relationship and Data Blend(Blending) of Tableau
- Autumn Battani, Make It Make Sense: B-I-N-G-O Template
- Anthony Smoak: Build an Interactive Tableau Resume to Get Noticed
- CJ Mayes: What’s Good? Illustrator & Tableau With Chimdi Nwosu. (November)
- Rebecca Gourley, RBG: How to: Convert dates into zodiac signs in Tableau
- Darragh Murray: A Cost of Insecurity – Comparing Spending on Military Capability v the Human Development Index
Are you ready for Tableau Conference?
Tableau Conference Register Today!
- Join Tableau and the world's largest data community online for three days of learning, connection, and inspiration. November 9-12, Register Today for Tableau Conference!
- Iron Viz: Who will be crowned the new champion of the world’s largest data visualization competition? The virtual stage is set for an intense lightning round of live viz-tastic storytelling. Don't miss it—November 10 at Tableau Conference.
- Connect with the DataFam at Tableau Conference 2021: We’ve pulled together this insider’s guide to help you connect with the DataFam and make TC21 your best one yet!
- TC21 Remo Pre-Game Event: Join the virtual DataFam meetup and meet Tableau Community members before the conference. Register for the virtual DataFam Remo hangout.
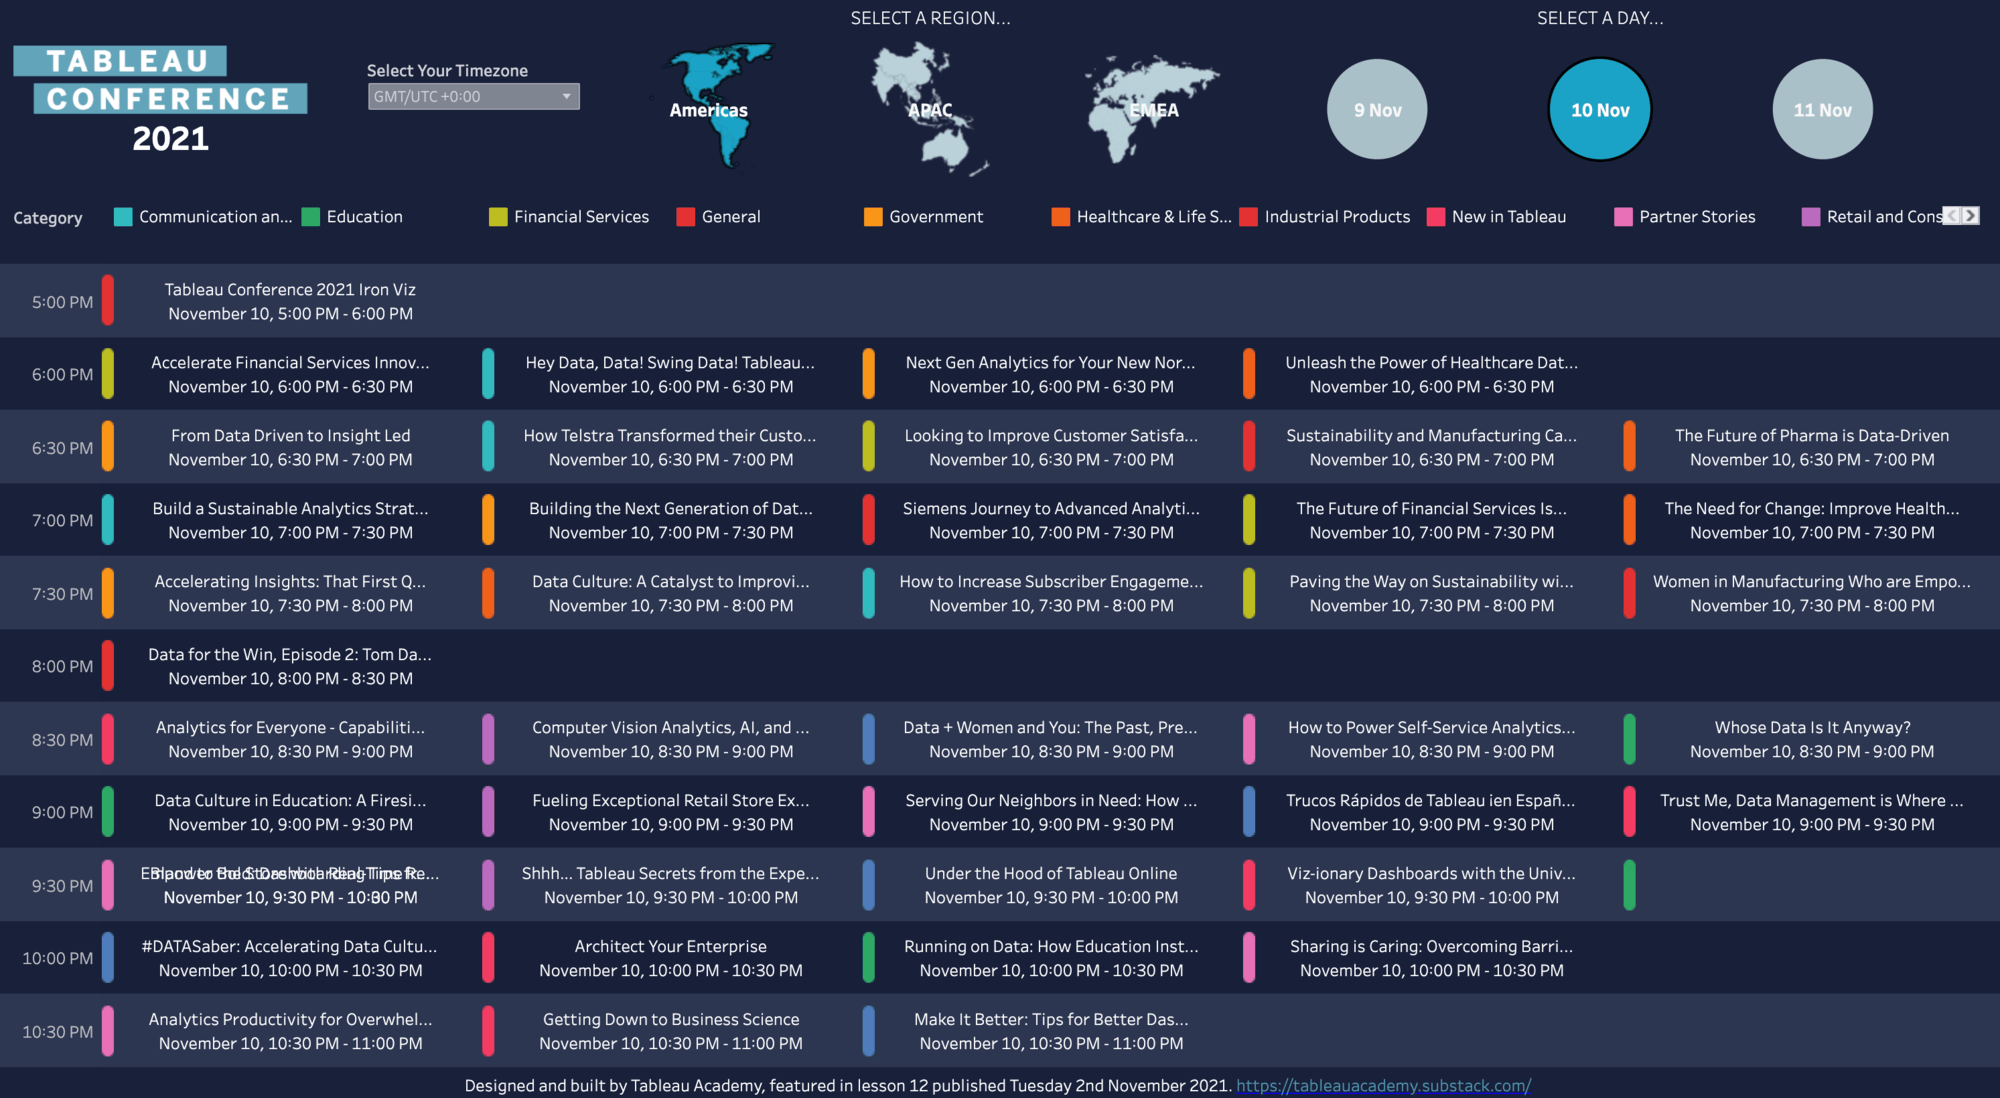
- Tableau Conference 2021 Dataset including sessions with category, descriptions, speakers, and more. Created by Ethan Hahn.
- Data+Love TC21 Afterparty: New episodes each day during November 9-11 featuring Lindsay Betzendahl, Kevin Flerlage, and Judit Bekker.
- Buddy Talks: Leveraging Tableau Conference 2021 hosted by Prasann Prem and Vani Agarwal.
Alan Murray: TC2021 Sessions Browser
- Alan Murray: TC2021 Sessions Browser visualization
- Tim Ngwena: Registering and setting up for Tableau conference 2021: It's Free!
- How I TC: A behind-the-scenes look at how Tableau leaders prepare for the biggest data event of the year
Vizzes
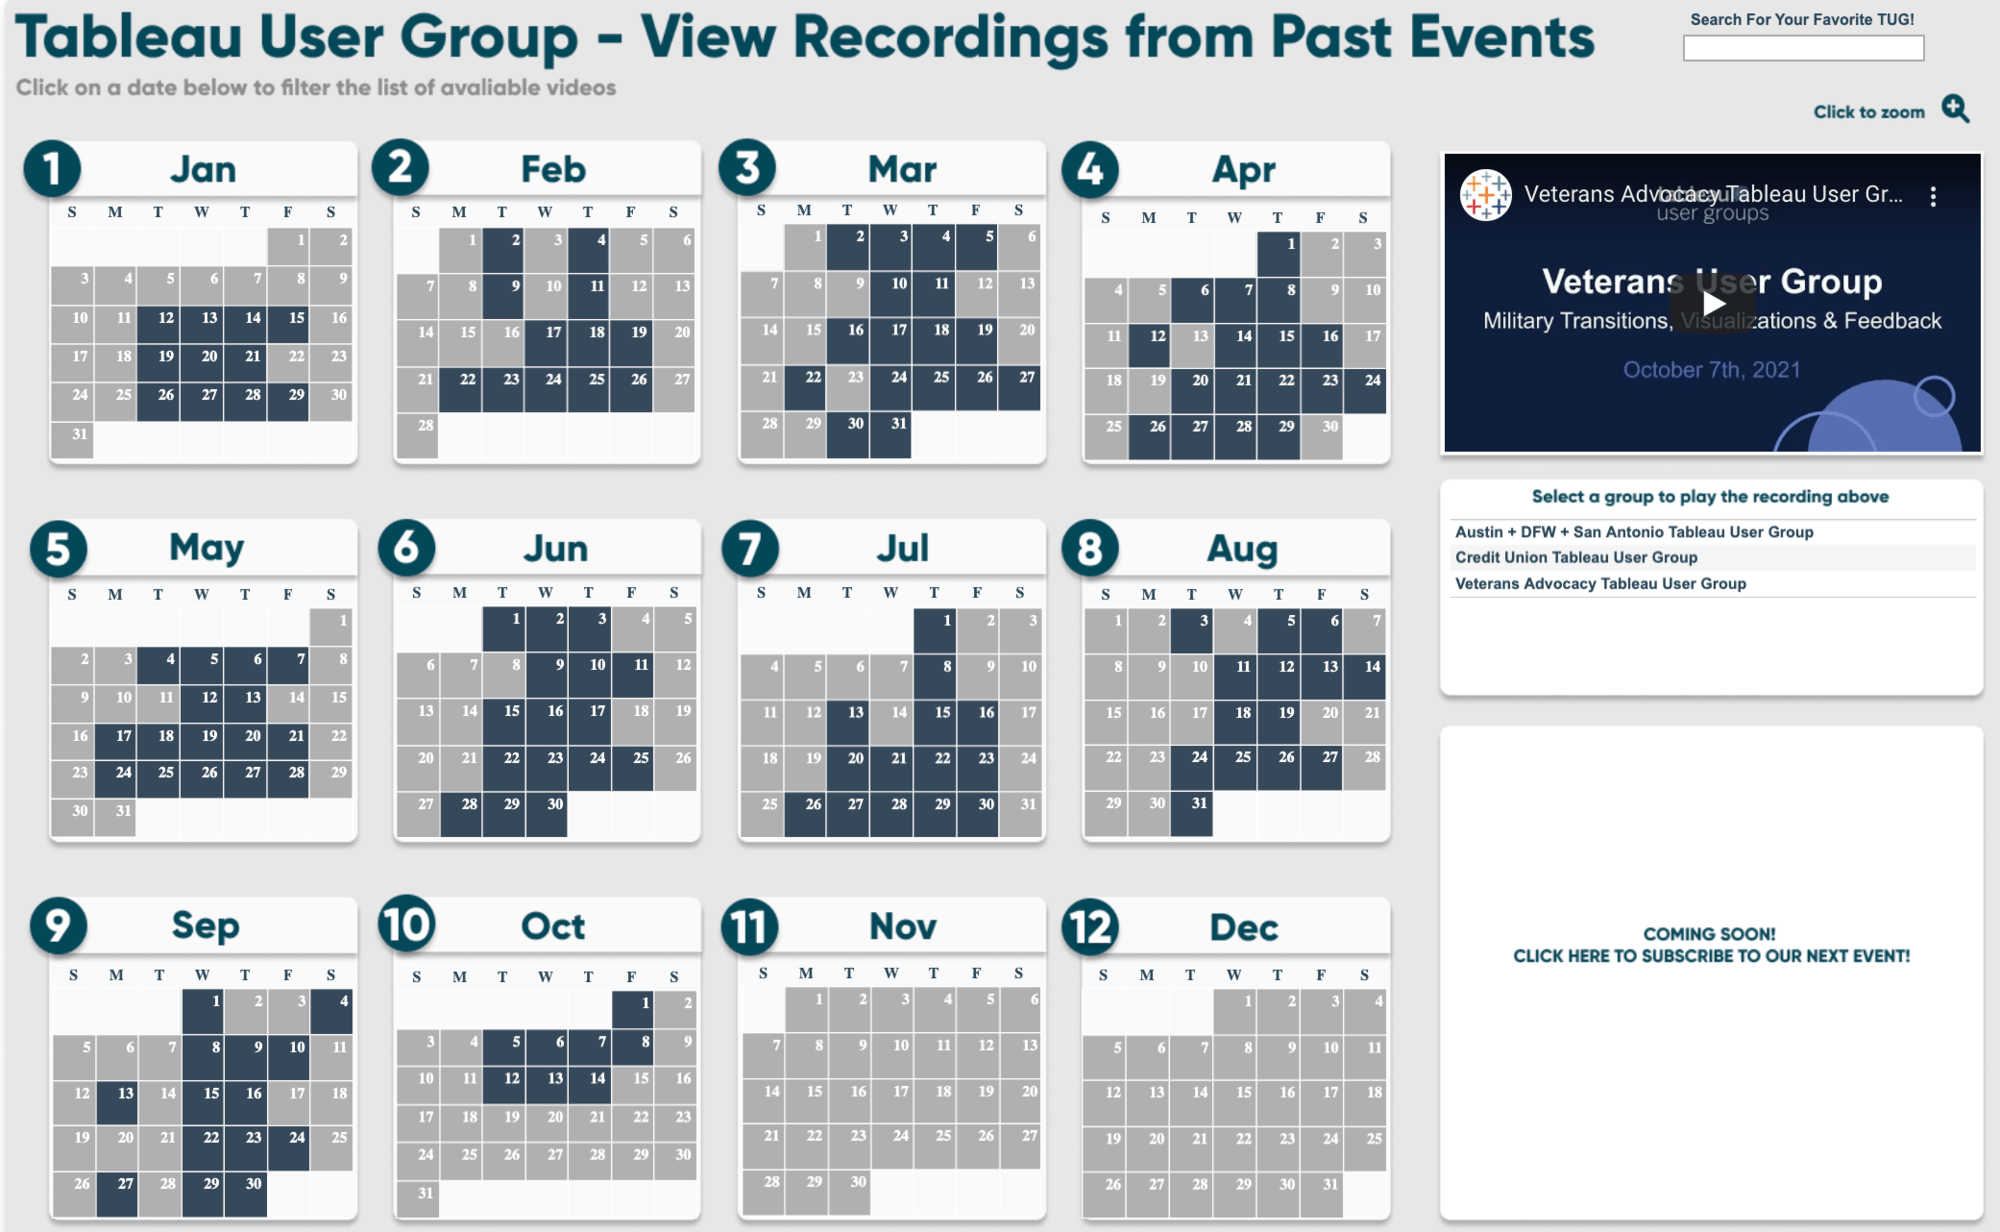
Ethan Lang: Tableau User Group - View Recordings from Past Events
Catch this week’s Viz of the Days here and subscribe to get them emailed directly to your inbox.
Check out some inspirational vizzes created by the community:
-
A.F: Japan Energy Flow
-
Kizley Benedict: Shaded Area Chart
-
Wendy Shijia: Singapore boba map
-
Ethan Lang: Tableau User Group - View Recordings from Past Events
-
Anastasiia (Asia) Komissarova: The United Nations: structure and goals
Community Projects
Workout Wednesday
Build your skills with a weekly challenge to re-create an interactive data visualization.
Web: Workout Wednesday
Twitter: #WOW2021
Week 44: Can You Show the Top and Bottom Profit Performers for the Selected Time Period?
Preppin' Data
A weekly challenge to help you learn to prepare data and use Tableau Prep.
Web: Preppin’ Data
Twitter: #PreppinData
Week 41: Southend Stats
Iron Quest
Practice data sourcing, preparation, and visualization skills in a themed monthly challenge.
Web: Iron Quest
Twitter: #IronQuest
October 2021: Viz a Year or Decade
Storytelling with Data
Practice data visualization and storytelling skills by participating in monthly challenges and exercises.
Web: Storytelling with Data
Twitter: #SWDChallenge
November 2021: build a bullet graph
Project Health Viz
Uncover new stories by visualizing healthcare data sets provided each month.
Web: Project Health Viz
Twitter: #ProjectHealthViz
September 2021: Biggest Healthcare Data Breaches
Diversity in Data
An initiative centered around diversity, equity & awareness by visualizing provided datasets each month.
Web: Diversity in Data
Twitter: #DiversityinData
November - December 2021: The countdown to Christmas and New Year!
SDG Viz Project
Visualize data about Sustainable Development Goals provided by the World Health Organization.
Web: SDG Viz Project
Twitter: #TheSDGVizProject
Sports Viz Sunday
Create and share data visualizations using rich, sports-themed data sets in a monthly challenge.
Web: Sports Viz Sunday
Twitter: #SportsVizSunday
Real World Fake Data
Create business dashboards using provided data sets for various industries and departments.
Web: Real World Fake Data
Twitter: #RWFD
Viz 2 Educate
Each month, create vizzes on global education syllabus topics as resources for teachers worldwide.
Web: Viz 2 Educate
Twitter: #Viz2educate
Viz for Social Good
Volunteer to design data visualizations that help nonprofits harness the power of data for social change.
Web: Viz for Social Good
Twitter: #VizforSocialGood
Makeover Monday
Join the community every Monday to work with a given data set and create better, more effective visualizations.
Web: Makeover Monday
Twitter: #MakeoverMonday
Autres sujets pertinents
Abonnez-vous à notre blog
Recevez toute l'actualité de Tableau.


