DataFam Roundup: March 13-19, 2021
Welcome back and happy Friday! Dig into the latest DataFam Roundup—a weekly blog post that brings together what’s trending in the community all in one post. As always, we invite you to send us your content—and the DataFam content from your peers that have inspired you! Find the content submission form here.
DataFam blog content
Introducing the Tableau Public Stats Service Ken Flerlage
Dive into content created by the Tableau Community:
- Tableau CRM – Where Is It Heading? Mark Tossell
- Introducing the Tableau Public Stats Service Ken Flerlage
- Inspiring Make Over Monday Viz Design Experience Satoshi Ganeko for Rajavel Selvaraj Ganesan(Vels)'s blog
- TTB #8: Heat grids, top tips, virtual escape rooms, managing feedback, datafam finder and more! Alan Murray
- Revenue Operations with Predictive Insights Kimya Rahnema
- A Collaborative Blog on Collaborative Vizzes Autumn Battani
- 2020: demografia d’impresa, come si misura la mortalità delle aziende? Filippo Mastroianni (Italian)
- Rethinking Data Visualization David Pires
- Mastering Containers in Tableau (Part 2) - Sales Performance Dashboard Andy Kriebel
Upcoming events

Data + Diversity: Bias in AI with Carol Reiley
Join an upcoming Tableau User Group event:
- March 25, 2021: Twin Cities Tableau User Group
- March 26, 2021: India Healthcare User Group
- March 31, 2021: NYC Tableau User Group: DataDev Edition
Check out all the virtual Tableau User Group events here.
March 30, 2021 Data + Diversity: Bias in AI with Carol Reiley: Join us as we go behind the scenes with entrepreneur, Artificial Intelligence roboticist and investor Carol Reiley to explore why the systems and designs fail in some applications and steps we can take collectively while working on these systems. We will discuss the current state of technology and share anecdotes as we embark on a new frontier for technology.
March 30, 2021 DataFam Community Hangout: Get the chance to meet some DataFam members in a relaxing atmosphere.
Vizzes

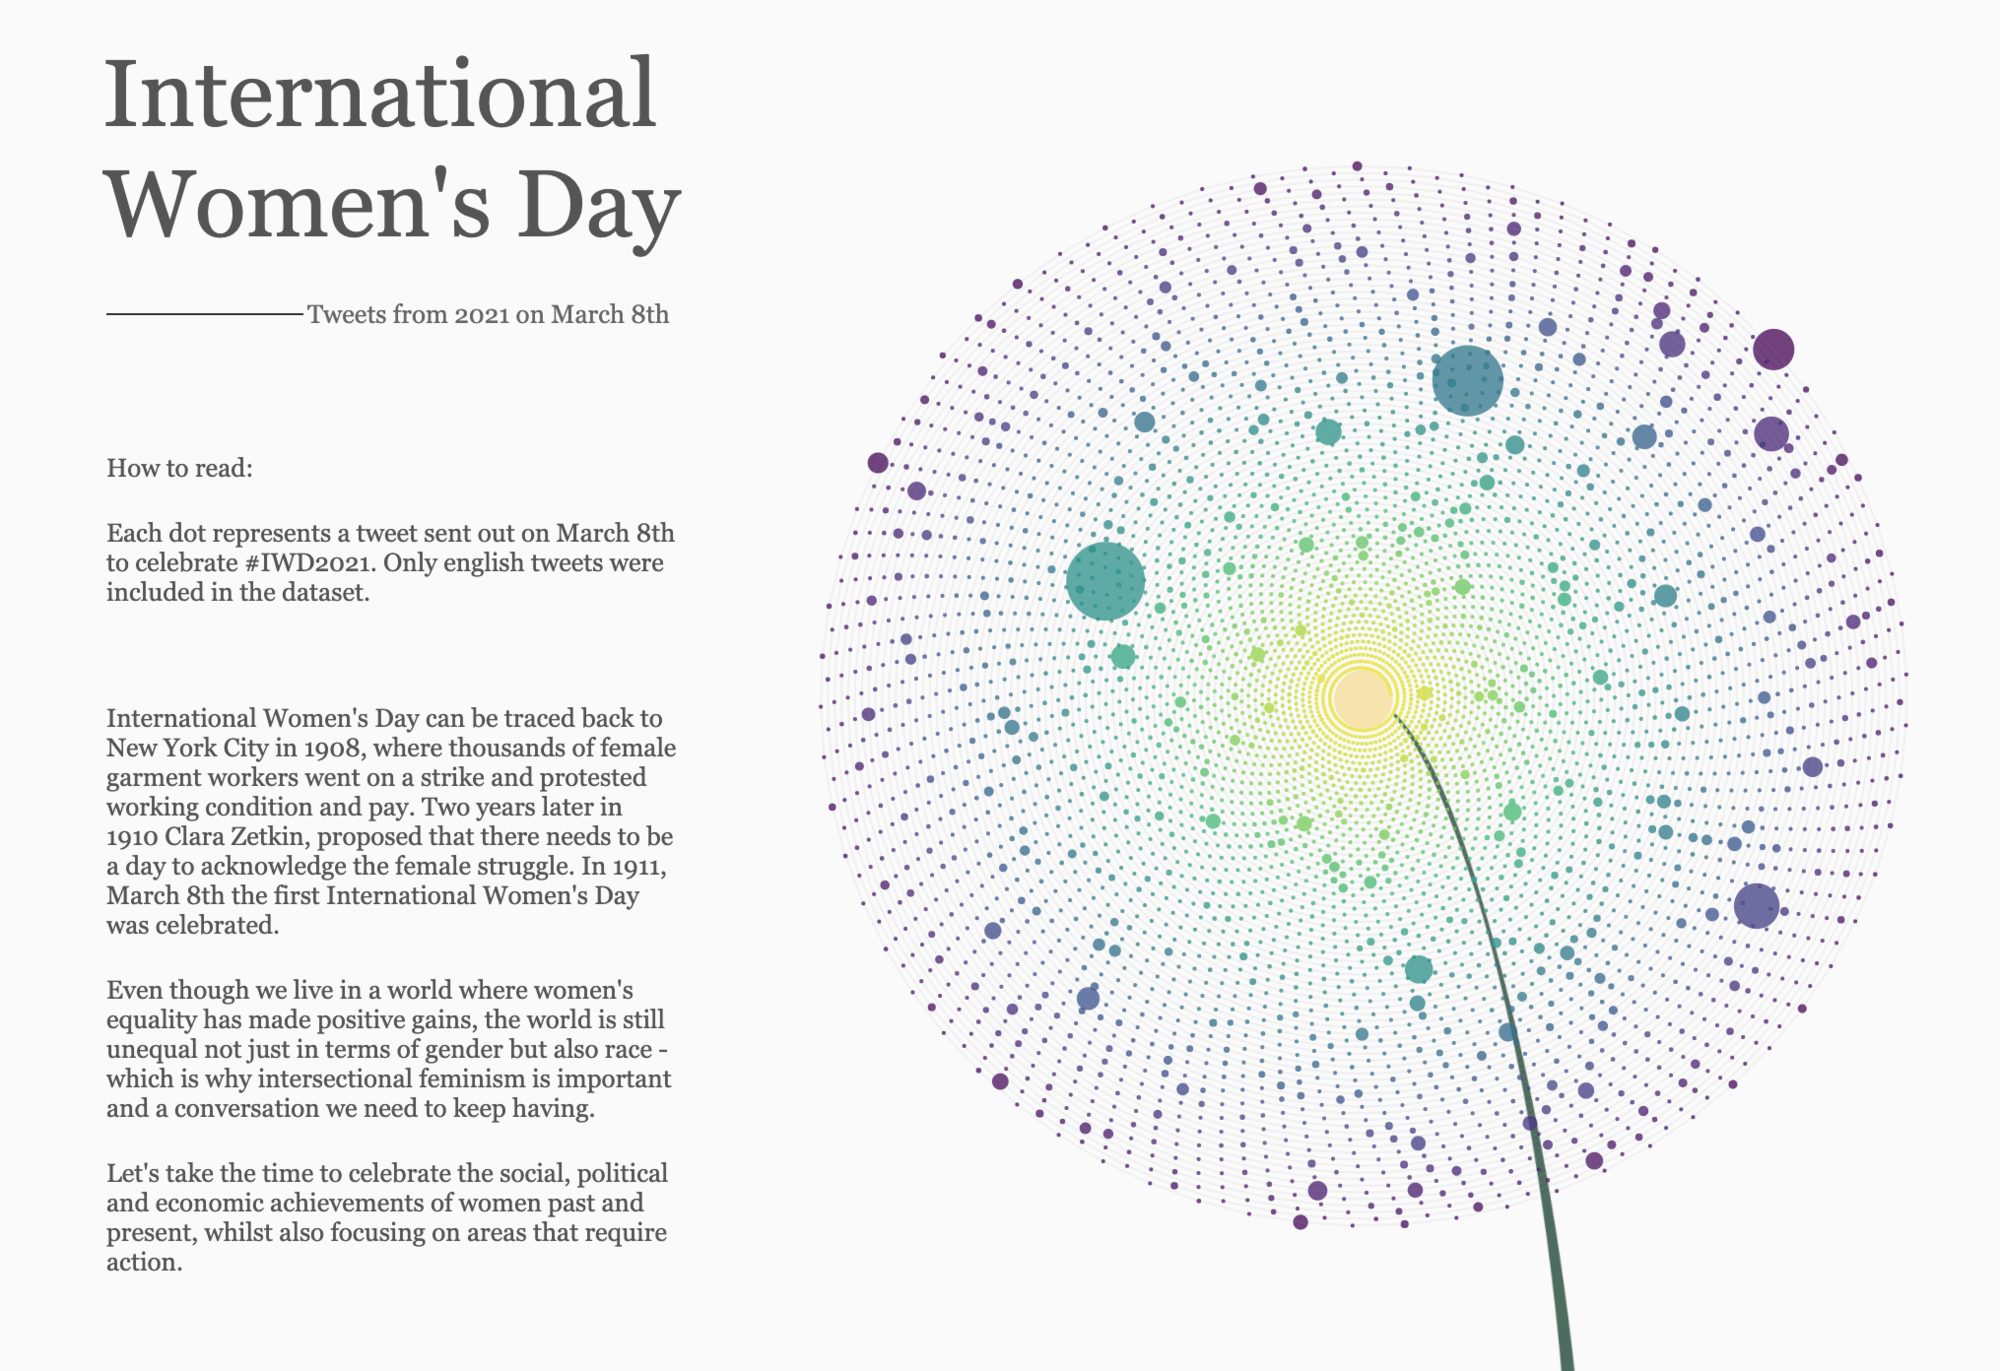
International Women's Day ,Soha Elghany
Catch this week’s Viz of the Days here and subscribe to get them emailed directly to your inbox.
Check out some inspirational vizzes created by the community:
- MCU Films Adam E McCann
- Ireland: A Land of Saints and Scholars Matt Herron
- International Women's Day Soha Elghany
Community Projects

Stay in the loop on the Tableau Community Projects:
Makeover Monday
Join the community every Monday to work with a given data set and create better, more effective visualizations.
Web: Makeover Monday
Twitter: #MakeoverMonday
Week 11: What's the World's Biggest Cash Crop
Workout Wednesday
Build your skills with a weekly challenge to re-create an interactive data visualization.
Web: Workout Wednesday
Twitter: #WOW2021
Week 10: Can you recreate the work of Hans Rosling?
Sports Viz Sunday
Create and share data visualizations using rich, sports-themed data sets in a monthly challenge.
Web: Sports Viz Sunday
Twitter: #SportsVizSunday
March 2021: Adaptive Sports
Iron Quest
Practice data sourcing, preparation, and visualization skills in a themed monthly challenge.
Web: Iron Quest
Twitter: #IronQuest
March 2021: Games
Storytelling with Data
Practice data visualization and storytelling skills by participating in monthly challenges and exercises.
Web: Storytelling with Data
Twitter: #SWDChallenge
March 2021: March MAPness
Project Health Viz
Uncover new stories by visualizing healthcare data sets provided each month.
Web: Project Health Viz:
Twitter: #ProjectHealthViz
March 2021: Adaptive Sports
SDG Viz Project
Visualize data about Sustainable Development Goals provided by the World Health Organization.
Web: SDG Viz Project
Twitter: #TheSDGVizProject
March 2021: Goal 14- Life Below Water
Preppin' Data
A weekly challenge to help you learn to prepare data and use Tableau Prep.
Web: Preppin’ Data
Twitter: #PreppinData
2021 Week 10: Cocktail Profit Margins
Real World Fake Data
Create business dashboards using provided data sets for various industries and departments.
Web: Real World Fake Data
Twitter: #RWFD
Dataset #7: Retail
Viz 2 Educate
Each month, create vizzes on global education syllabus topics as resources for teachers worldwide.
Web: Viz 2 Educate
Twitter: #Viz2educate
February: History
Viz for Social Good
Volunteer to design data visualizations that help nonprofits harness the power of data for social change.
Web: Viz for Social Good
Twitter: #VizforSocialGood
Feb 20, 2021-Mar 14, 2021: Vera Aqua Vera Vita
Diversity in Data
An initiative centered around diversity, equity & awareness by visualizing provided datasets each month.
Web: Diversity in Data
Twitter: #DiversityinData
March 2021: Adaptive Sports
Autres sujets pertinents
Abonnez-vous à notre blog
Recevez toute l'actualité de Tableau.


